I think the index numbers for the row of the averaging window function is shifted and that seems to be an error. To get this opinion, I made the following test using QGIS and a subsample of the both datasets you left in the dropbox.
In first step I cut out a windows in the region of your interest ..some where to address an area in the northern part of the Red Sea:
gdal_translate -projwin 0 50 50 0 temp_CHIRPS_201512.tif hires.tif
gdal_translate -projwin 0 50 50 0 CHIRPS_201512_ave.tif lowres.tif
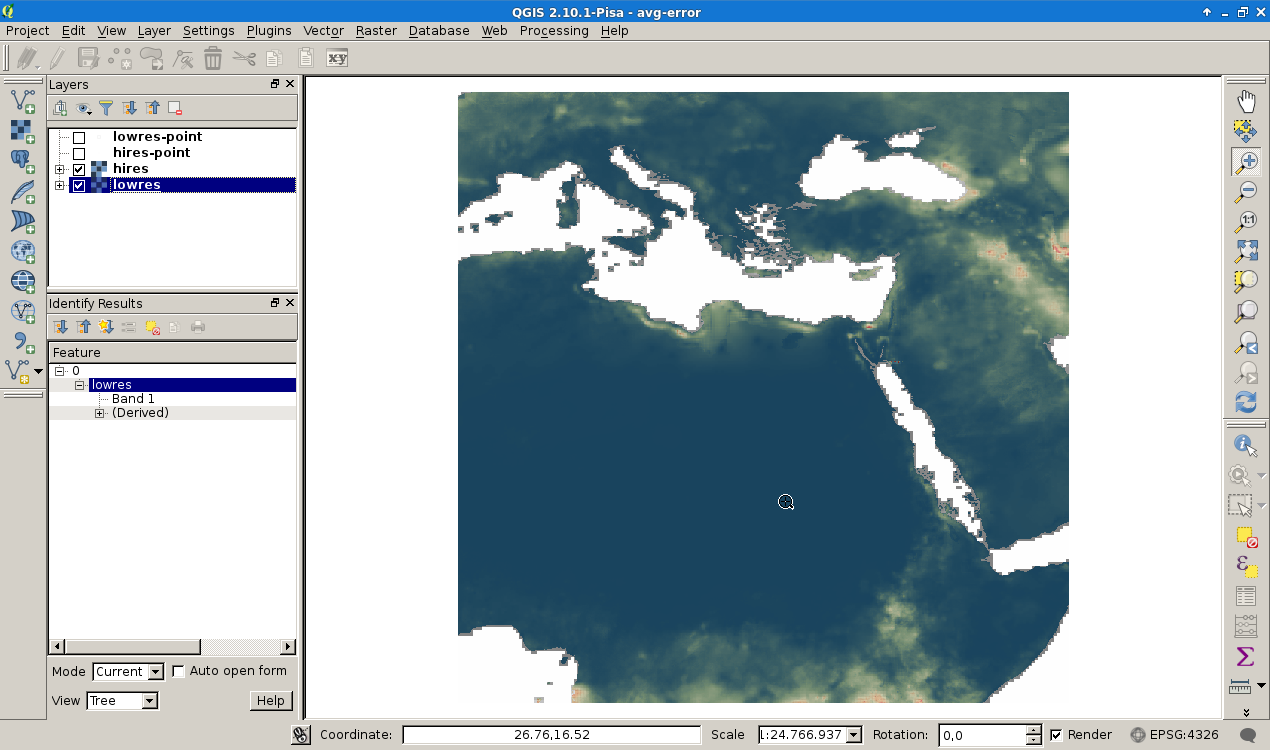
I call the full resolution image hires.tif and the averaged one lowres.tif. To see what the gdalwarp tool produces I built xyz files to get frames and numbers corresponding to the cells
gdal_translate hires.tif hires.xyz -of xyz
gdal_translate lowres.tif lowres.xyz -of xyz
and import the stuff into QGIS via Layer -> Add Layer -> Add Delimited Text Layer with the following settings:
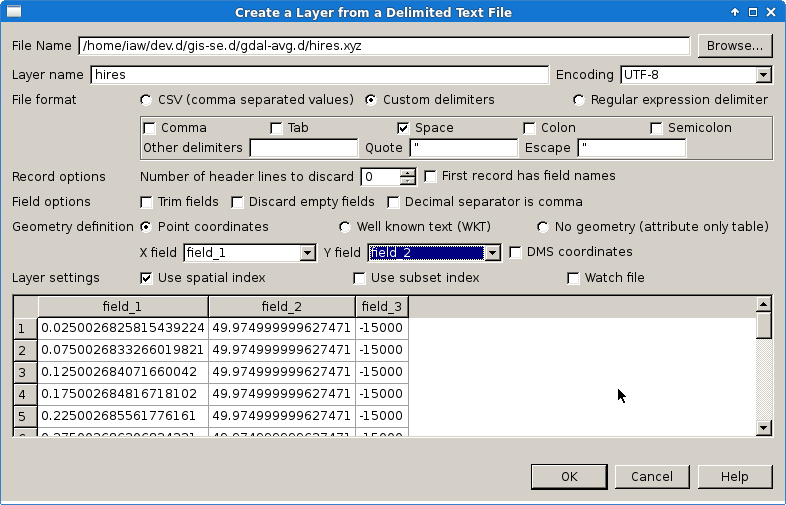
The same procedure was applied to the lowres stuff. I zoom to the paninsula of Sinai and set the symbology of the raster to a squared marker without background and a size of 0.05 map units for the hires positions and 0.25 map units for the lowres points (your produced raster sizes).
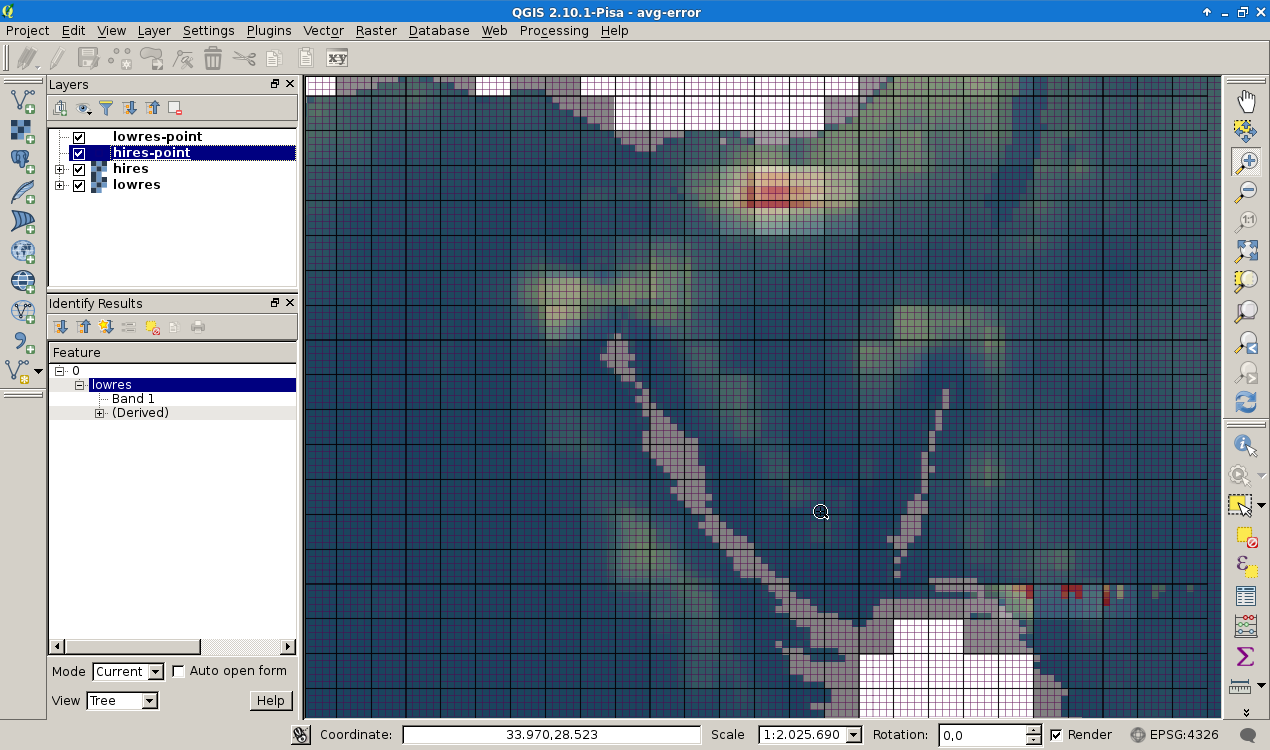
I choose colored symbology for the hires raster:
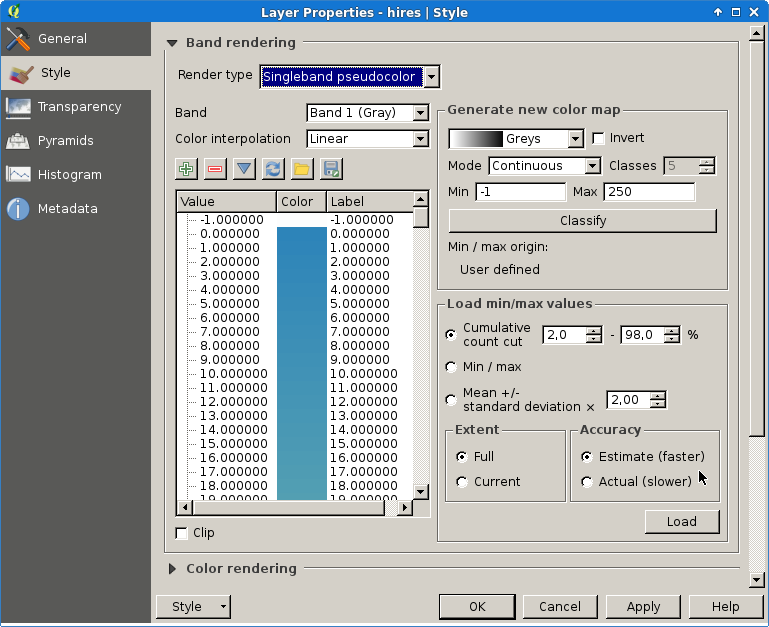
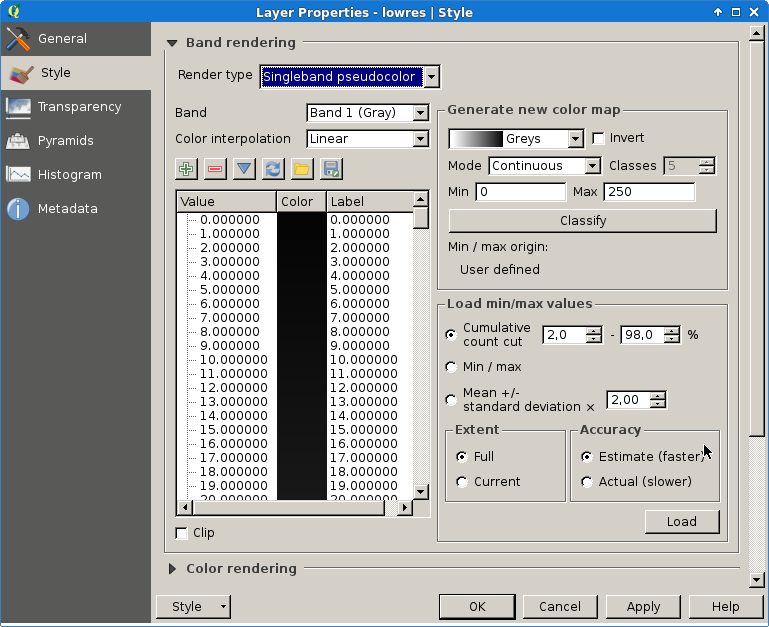
and a gray setup for the lowres (averaged) raster to bring out the artefacts.
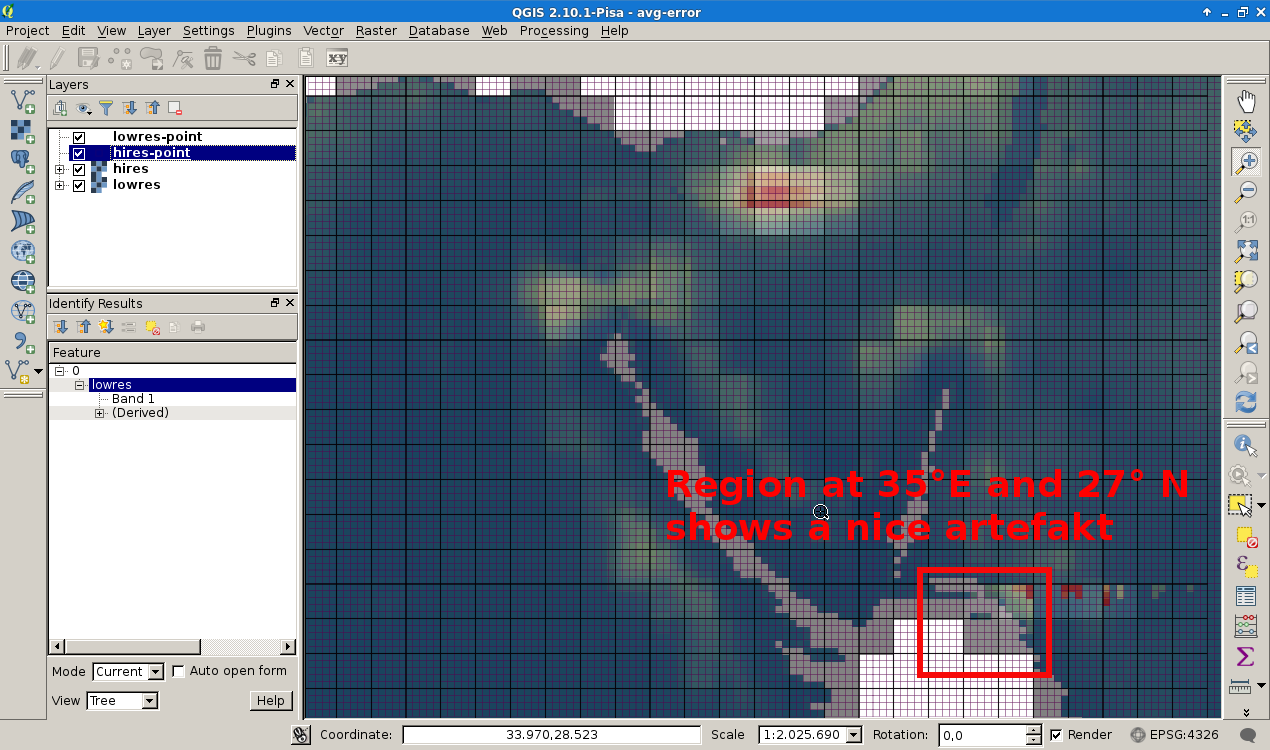
At 35° East and 27° North we find a nice artefact that should be a -15000 cell (NA in GNU-R speech).
To see whats happend I zoom in and label the cells:
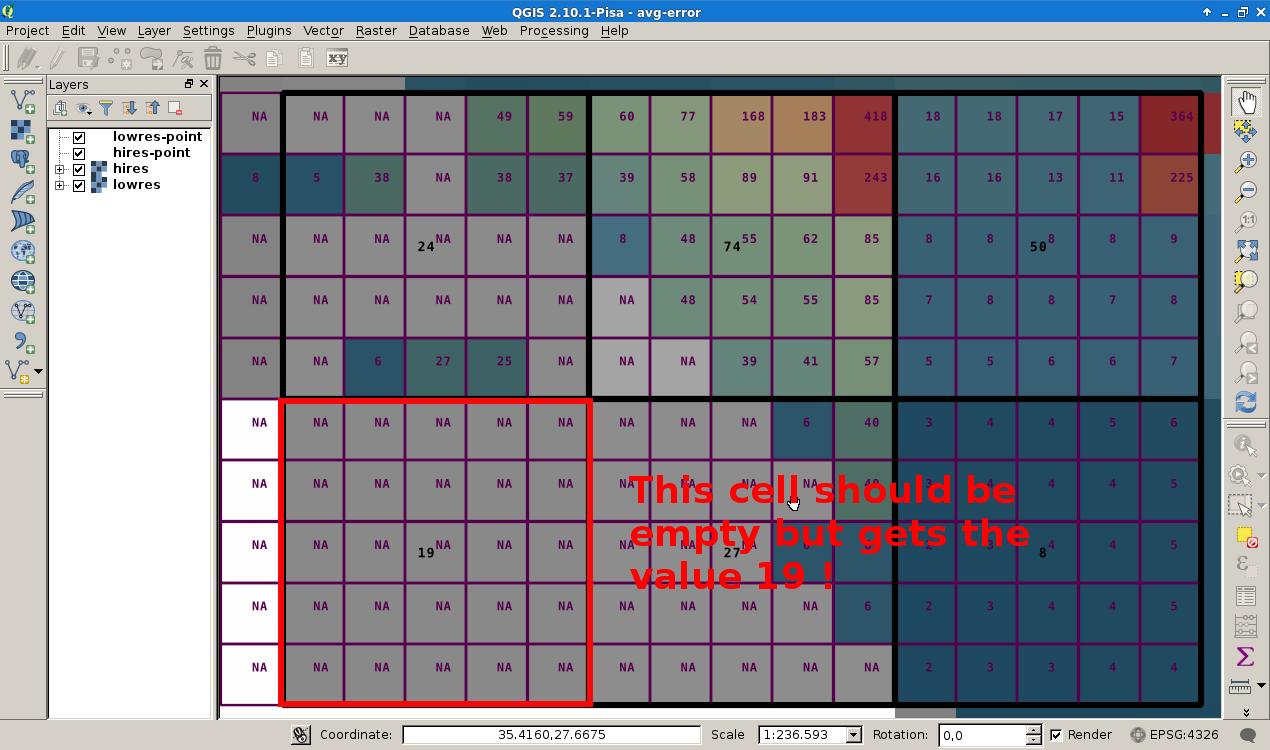
It seems, that we have a cell shift and the average is calculated from a wrong set of samples,
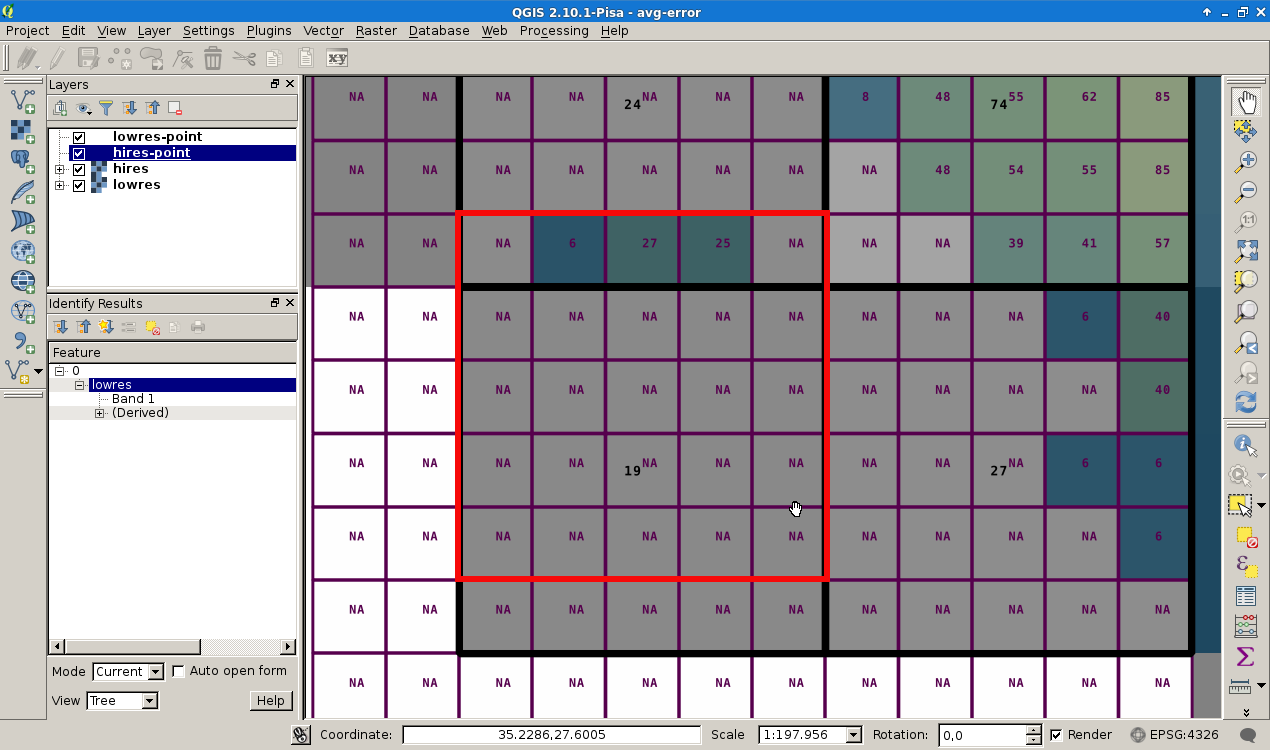
because if I use to north shifted window, I will calculate:
> cell <- c(
+   NA,  6, 27, 25, NA,
+   NA, NA, NA, NA, NA,
+   NA, NA, NA, NA, NA,
+   NA, NA, NA, NA, NA,
+   NA, NA, NA, NA, NA
+ );
> mean(cell,na.rm=TRUE)
[1] 19.33333
and get the magic 19 at a wrong place in the raster. I think you should send a bug report to the gdal community.
Sorry forgot to use python...
In [1]: import numpy

In [2]: cell = numpy.array ([
   ...:   None,  6, 27, 25, None,
   ...:   None, None, None, None, None,
   ...:   None, None, None, None, None,
   ...:   None, None, None, None, None,
   ...:   None, None, None, None, None
   ...: ])

In [3]: numpy.mean(filter(None, cell))
Out[3]: 19.333333333333332
In this dropbox you will find the test environment with:
avg-error.qgs the qgis project temp_CHIRPS_201512.tif your hires fileCHIRPS_201512_ave.tif your lowres file hires.tif the 0 50 50 0 cut version of the hires filehires.xyz the xyz export of the hires cut versionlowres.tif the cut version of the lowres filelowres.xyz the xyz export of the hires cut version hires-point.qml style to draw the cells hires.xyzlowres-point.qml style to draw the cells lowres.xyzhires-raster.qml style to draw the hires rasterlowres-raster.qml style to draw the lowres raster howto code snippets
enjoy...


