7

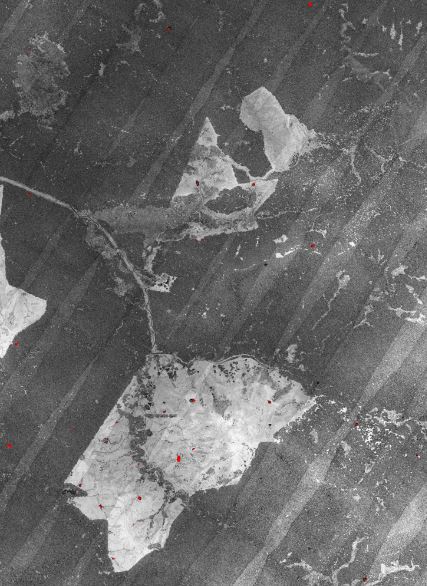
I'm working with multiple raw las tiles, and I've used Fusion to create an intensity image, but it shows the flight line overlap (see below). Any idea how can I smooth the image so that the overlap is blended into the rest of intensity values. Do I need to do any calibration or correction?

Can you please advise what tool I can use?

intensity image created

2 Answers 2

4

This effect could be a consequence of having different point densities within the flight line overlap regions. A possible solution would be to homogenize the LiDAR cloud.

With Fusion the command line to accomplish such task is ThinData:

ThinData allows you to thin LIDAR data to specific pulse densities. This capability is useful when comparing analysis results from several LIDAR acquisitions that were collected using different pulse densities. ThinData is also useful when the density within a single LIDAR data set is not uniform. ...

ThinData works by randomly removing entire pulses from the LiDAR cloud1, according to settings of desired pulse density and cell size.

The general syntax of the command line is:

ThinData [switches] OutputFile Density CellSize DataFile

The algorithm will take into account the actual pulse density, the desired one and will remove pulses considering the cell size chosen in the command line. See in the manual, the section 'Technical Details' for detailed guidance about setting ThinData's arguments.

A hint would be to run the command line Catalog using the switch density:, to discover how much the density of points varies throughout the point cloud and inside flight line overlap areas. Then, run ThinData, and after that, the tools being used for generating the LiDAR intensity image.

It is important to mention that the intensity statistic is unstable and it requires calibration. See the following excerpt from Bater et al. (2011):

The intensity of a pulse return is the ratio of received to transmitted energy and is influenced by a variety of factors, including range to target, incidence angle, bidirectional reflectance distribution function, atmospheric transmittance and attenuation, transmitted power, and beam divergence. In their examination of interpolated intensity values, Boyd and Hill report visible differences between adjacent flight lines and attributed the differences to a lack of calibration between lines. The results presented here indicate that the intensity values were strongly and significantly different between flight lines.


Bater, C. W.; Wulder, M. A.; Coops, N. C.; Nelson, R. F.; Hilker, T.; Nasset, E. (2011). Stability of Sample-Based Scanning-LiDAR-Derived Vegetation Metrics for Forest Monitoring. IEEE Transactions on Geoscience and Remote Sensing, 49(6), 2385–2392. doi:10.1109/TGRS.2010.2099232


1See Thinning large LiDAR point cloud?, for more options of algorithm/software for thinning LiDAR data.

4
  • Hi Andre, thanks a lot for the suggestion. I've tried that and it significantly improved the results, but it didn't completely solve the problem. Even after I've thinned the data down to 1 point/m2, the flight line pattern still shows at some places. Do you think I can filter the image? Do you know what the standard approach is for processing intensity image? As I don't seem to see other people have the problem. Many Thanks, Vega
    – user56104
    Commented Aug 6, 2015 at 5:17
  • It is hard to say; because ThinData improves the homogeneity but it can't homogenize completely. Also, it is known that intensity statistic is not stable because it can vary with many things during the flight other than the target. I can't figure right now what else could be done to improve accurately the results. (@user56104) Commented Aug 6, 2015 at 11:12
  • @AndreSilva - For me, much more troubling than the extra density in the overlap strips, is that sometimes I encounter a slight discrepancy between the flight paths. I.E. if take slope between two "nearby" points, one from each path, that slope is substantially higher than the actual slope (measured within a flight path), when those points fall quite close to each other. Is there any thinning software that says "if two points are within X distance AND FROM DIFFERENT FLIGHT PATHS, then average them" (or if average isn't practical, keep only the first such point)? Commented Apr 16, 2017 at 2:13
  • Hmm, thinking it through, given that thinning to a grid size didn't completely eliminate the "edge", this means I'd have to set this "min distance between flight paths" to at least 1.5 times grid edge - so would eliminate one row of data points between flight paths. That would be much better than having the false slopes, but loses resolution at edges. May require doing fit between flight paths to solve this. Commented Apr 16, 2017 at 2:44
4

We recently stubled across this issue as well and it is documented here: The merged LiDAR shows the trouble you report. The reason is that one flightline is much brighter than the other flightline so that the LiDAR points cannot simply be merged and have their intensity processed together. In the same flightline you also notice the negative effects of clouds on the consistency of your intensities.

I assume you still have the means to split the LiDAR back into its original flightlines? In the ideas case you also have trajectories so that you can normalize the intensities of LiDAR points with the distance from the plane.

What we ended up doing was simply to create two histograms and then apply a simple scale to one flightline to make the distributions in the two histogram match more closely (e.g. scale such that the peak of the two histograms have about the same value). Of course you need to do this on the LiDAR points before merging flightlines and rasterizing their intensities.

1
  • 2
    +1. I'd also recommend people reading the reply of Jason Stoker here. Commented Aug 11, 2015 at 12:03

Your Answer

By clicking “Post Your Answer”, you agree to our terms of service and acknowledge you have read our privacy policy.

Not the answer you're looking for? Browse other questions tagged or ask your own question.