52

I'm looking for a way to insert continuous colour legend for a raster layer. I managed to create discrete symbols with values along the bar, but I would like to have a continuous bar with some values on the bar, similar to the old plugin "One-Band Raster", that it doesn't work with the QGIS version higher than 1.7

I tried to set in properties->style, where I selected the Render Type "Singleband pseudocolor" and see the "generate new color ramp" box. I tried both "Continuous" or "Equal interval". However, in the Composer the legend always is displayed with discrete symbols.

Is there any way that can make QGIS Composer to display a nice continuous band for a raster layer?

1
  • I'm afraid that it is not possible in QGIS for the legend item. The workaround is to create an image and insert it in composer. For continuous colors of the raster, select linear interpolation.
    – radouxju
    Commented Mar 28, 2014 at 7:47

8 Answers 8

73

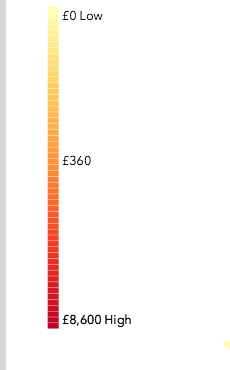
Update: QGIS 3.18 now has built in support for gradient color band legend items, so the previous workarounds are no longer necessary!

For earlier versions:

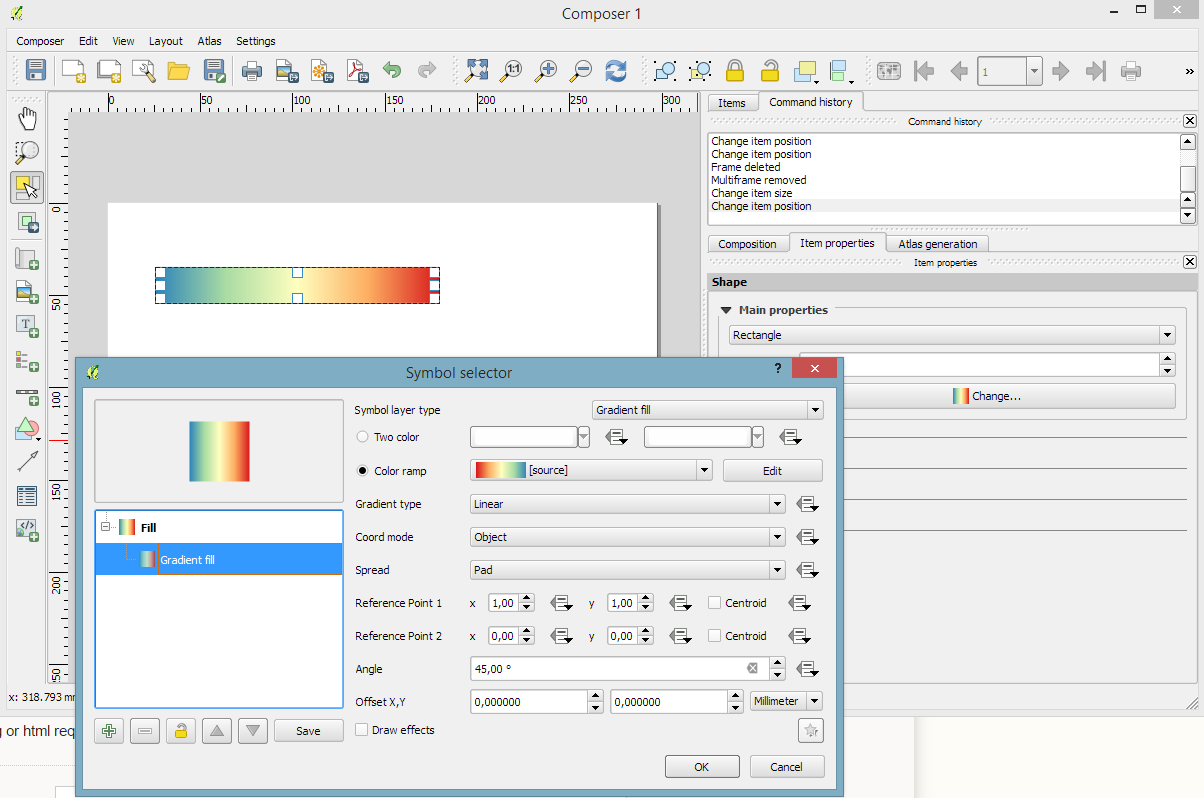
Another option is to add a rectangle shape to the composition, then style the rectangle using a gradient fill with the same color ramp as your raster. This can be done directly in QGIS, no image editing or html required.

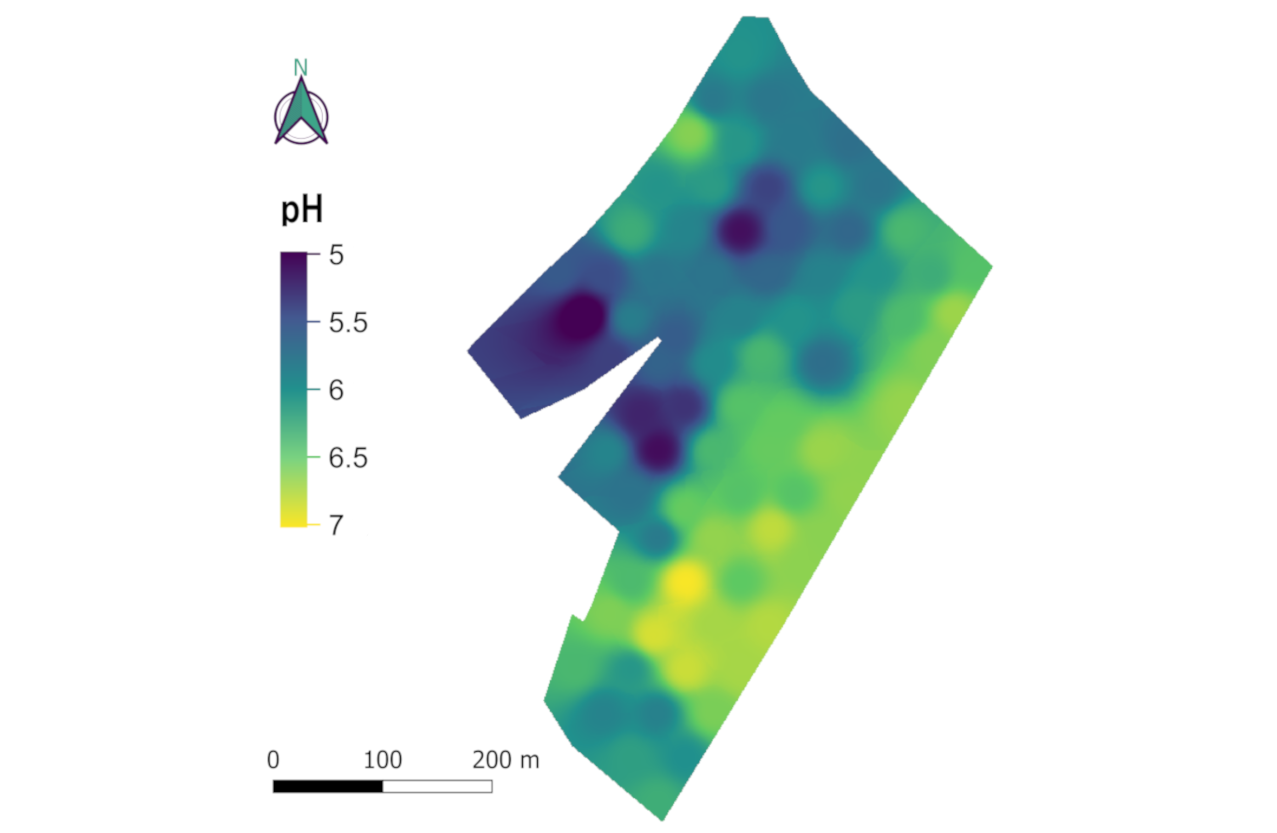
enter image description here

5
  • 2
    This doesn't provide necessary measurements for the legend, though
    – Shawn
    Commented Oct 5, 2018 at 1:53
  • Should provide QGIS version information.
    – Chang
    Commented Jul 26, 2019 at 0:03
  • how can I add text below this bar? I used "add label" but is there a less manual solution?
    – Lucas
    Commented Apr 20, 2020 at 12:23
  • 2
    Here's a video tutorial on using the new functionality for QGIS 3.18+: youtu.be/cHhn1g5B6Do
    – Hansakwast
    Commented Feb 25, 2021 at 8:56
  • 1
    You say that QGIS 3.18 has the option now but I can't seem to find it. I am on version 3.20.3-Odense. Can you explain more? Just a quick clarification: I am dealing with a vector layer, not a raster. Commented Sep 8, 2022 at 8:05
23
+100

A bit of a hack round to get composer to do this in QGIS 3

Add your legend, then adjust the symbol size in your legend to something small (example is 1.5mm). You'll still see white lines dividing the colour bands, these seem to relate to the font size for the legend text so set this to zero.

You can then add manual labels along the gradient and a rectangle to mask the legend text, or set that text to white.

This doesn't give a perfect gradient as some small white lines remain but for my purposes this was good enough.

Edit; This was tested on QGIS version 3.4.1-Madeira

As below;

enter image description here

2
  • I awarded a bounty to this answer because it was the only one that mentioned the version (albeit just the major release) number to which it applies.
    – PolyGeo
    Commented Feb 11, 2019 at 0:28
  • You may also need to adjust the "Symbol space" under "Spacing" and uncheck the box by "Draw stroke for raster symbols" under "Symbol" Commented Mar 21, 2019 at 23:05
15

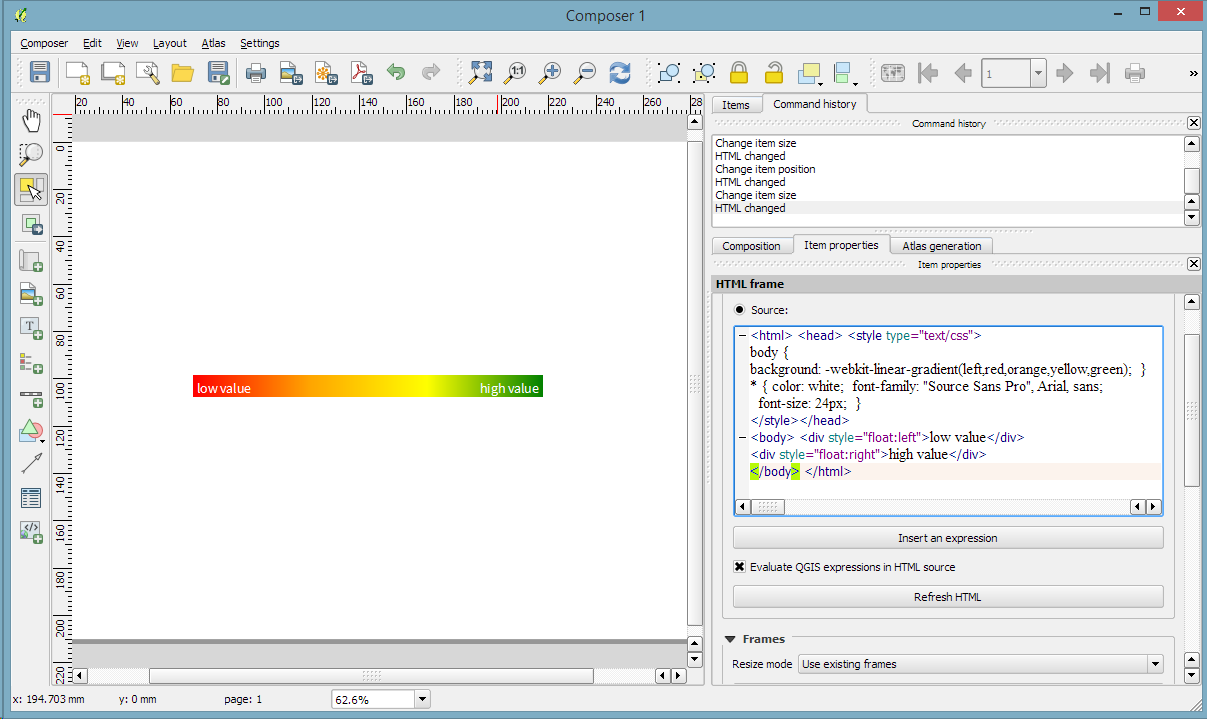
A workaround without pictures is to add the gradient using a HTML frame and some CSS magic:

<html> <head> <style type="text/css"> 
body { background: -webkit-linear-gradient(left,red,orange,yellow,green);  }
* { color: white;  font-family: "Source Sans Pro", Arial, sans; font-size: 24px;  }
</style></head>
<body> <div style="float:left">low value</div>
       <div style="float:right">high value</div>
</body> </html>

enter image description here

1
8

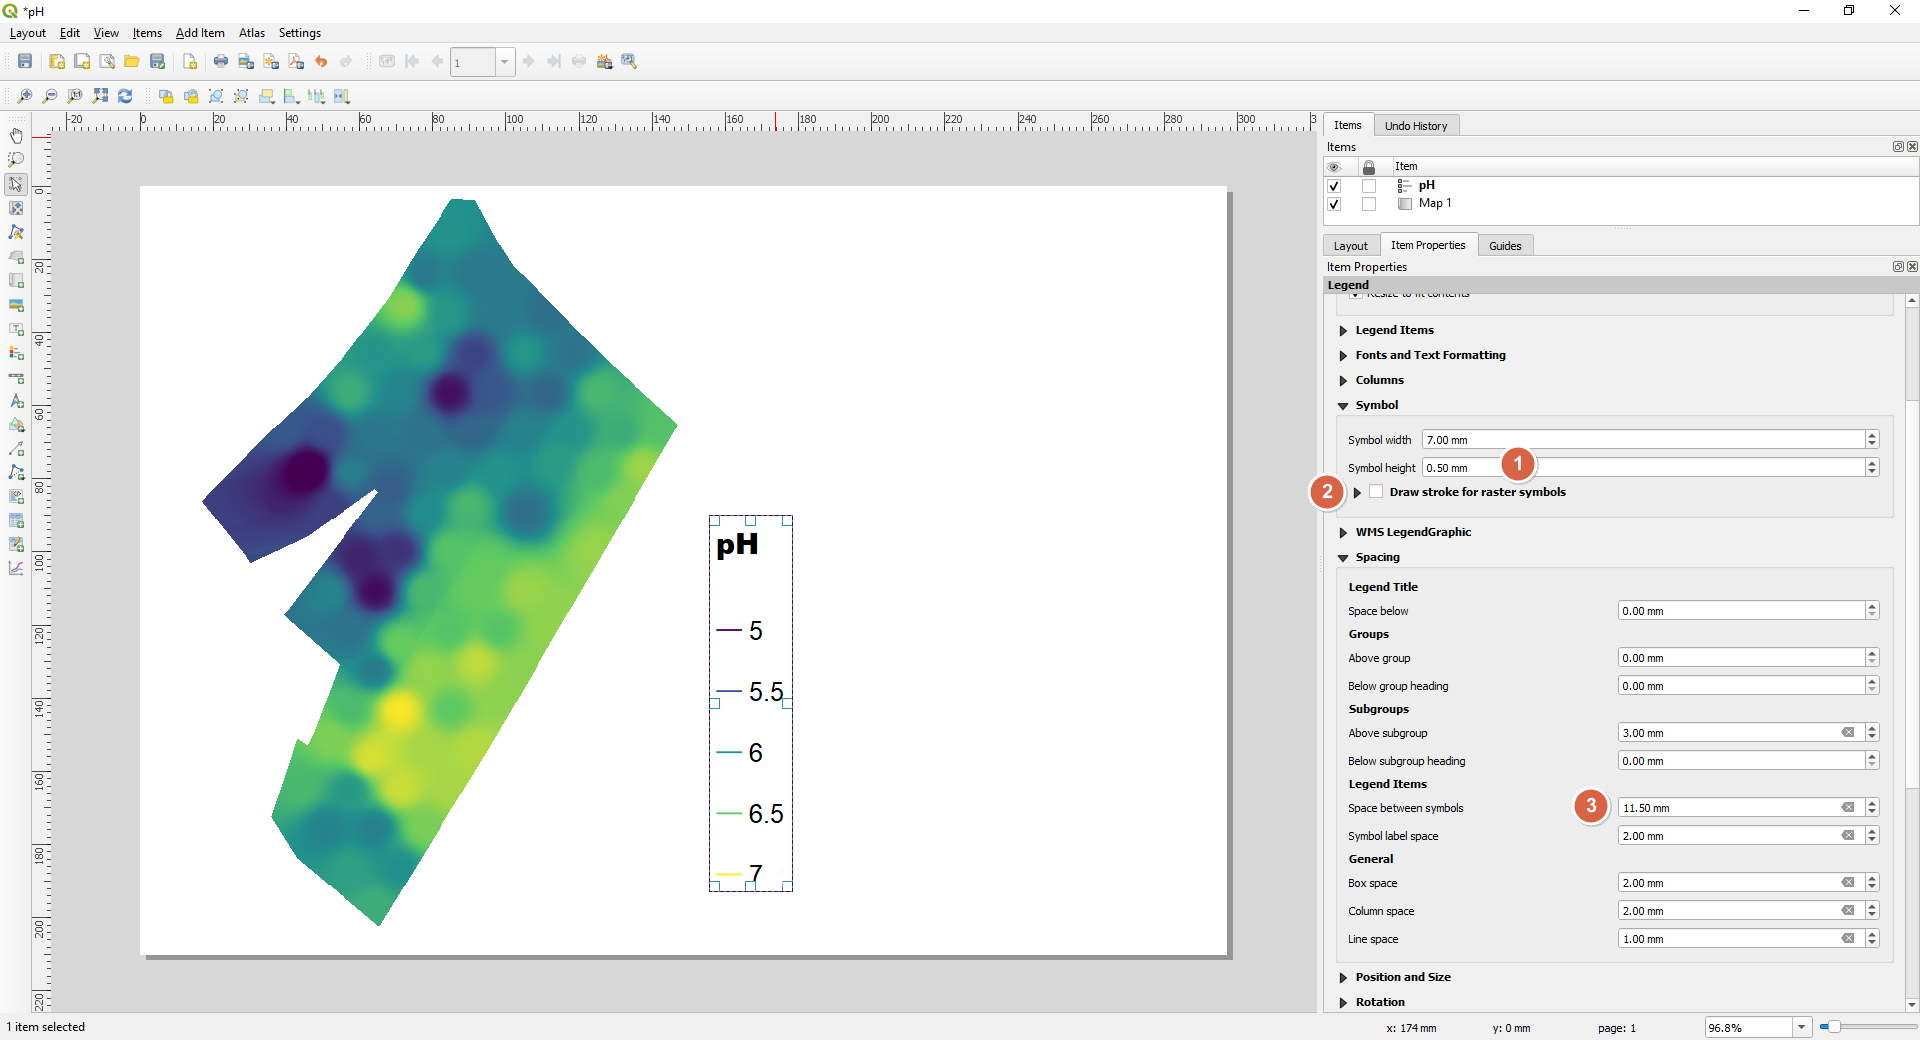
An old question, but as I couldn't get the plugin mentioned above to work, here another work-around, tested on QGIS 3.12.3.

  1. Add a legend with limited number of discrete classes (enough to capture the gradient).
  2. In the composer, add the raster layer and legend.
  3. Under symbol, reduce the height of the symbols (1), deselect the ‘draw stroke for raster symbol’ (2), and under spacing, increase the spacing between symbols (3).

enter image description here

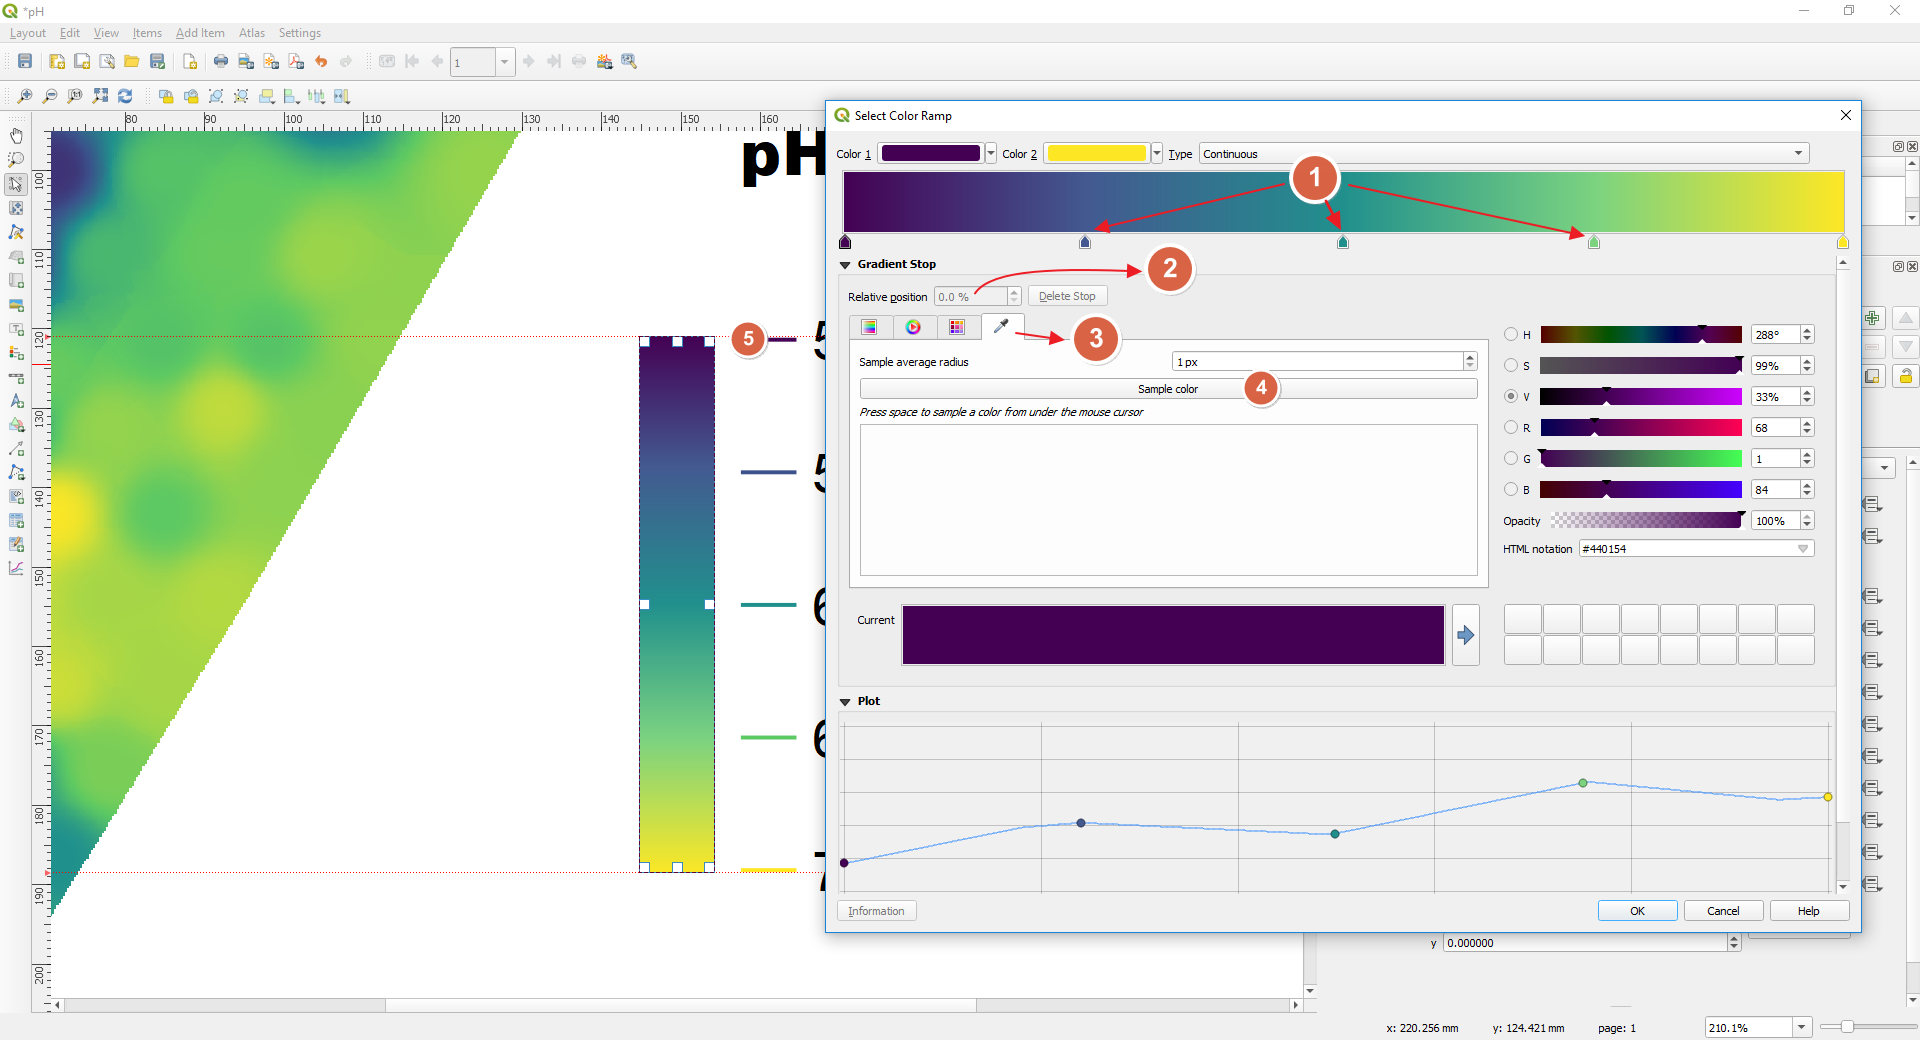
  1. Place a rectangle next to the legend, and select as style gradient fill.
  2. Select the colour ramp, and then the option to edit it.
  3. Now, add as many stops, minus two, as you have colours (1). Place the stops at the right relative distances (2) and use the sample colour function (3, 4) to define the colours.

enter image description here

  1. Now you can move the rectangle on top of the legend symbols to complete it. Group the two together to make it easier to freely move the legend around. More details at Ecodiv.earth

enter image description here

4

This option is not included in QGIS but here is what I do:

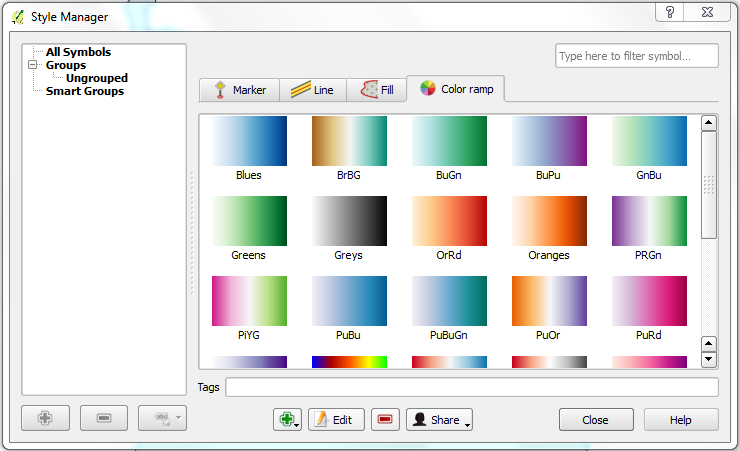
First classify using desired color ramp. Then go to Settings -> Style Manager -> Color Ramp (shows in figure below): enter image description here

Now you can use 'Snipping Tool' to copy the ramp that you used. For example figure below shows the 'Blues' color ramp copied using snipping tool:

enter image description here

Now, in 'Composer Manager', use 'Add Label' and 'Add Image' to add continuous color ramp along with legend. To get the 'Max' and 'Min' value for continuous color ramp use, Layer Properties -> Style.

4

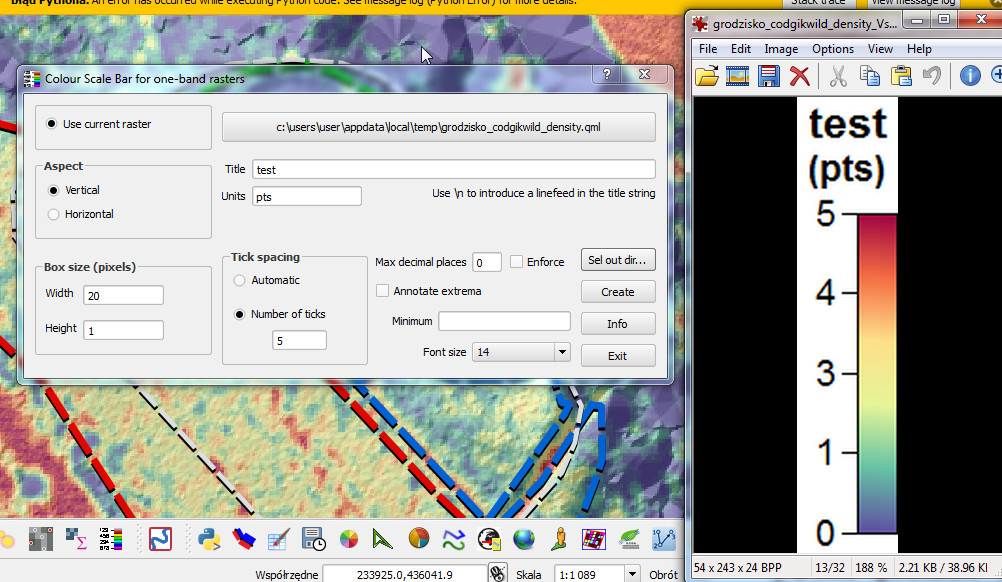
There is a qgis plugin to do this in the main repository: Colour Scale Bar for One-Band Rasters and works well for me for QGIS 2.X https://github.com/BC-Consulting/bccscbar or QGIS 3.X https://github.com/BC-Consulting/geoprocalgos

enter image description here

6
  • Could you please add install instructions? Commented Oct 12, 2017 at 14:40
  • 1
    At first I thought I had installed it wrong, but it seems this plug-in simply does not work. You might wish to revise or update your answer. Commented Oct 12, 2017 at 14:47
  • The plugin is working just fine and You will finde it in the main Plugin Repository look for Colour Scale Bar
    – m_kos
    Commented Oct 18, 2017 at 5:56
  • 2
    This plugin is not for QGIS 3; developed for QGIS 2.x, and is backward compatible with .qml's generated with QGIS versions 1.x.
    – Shawn
    Commented Oct 5, 2018 at 1:55
  • This plugin is not available anymore for even LST V2.18. The web link at the beginning of the answer is not valid anymore as well. Commented Nov 14, 2019 at 7:52
3

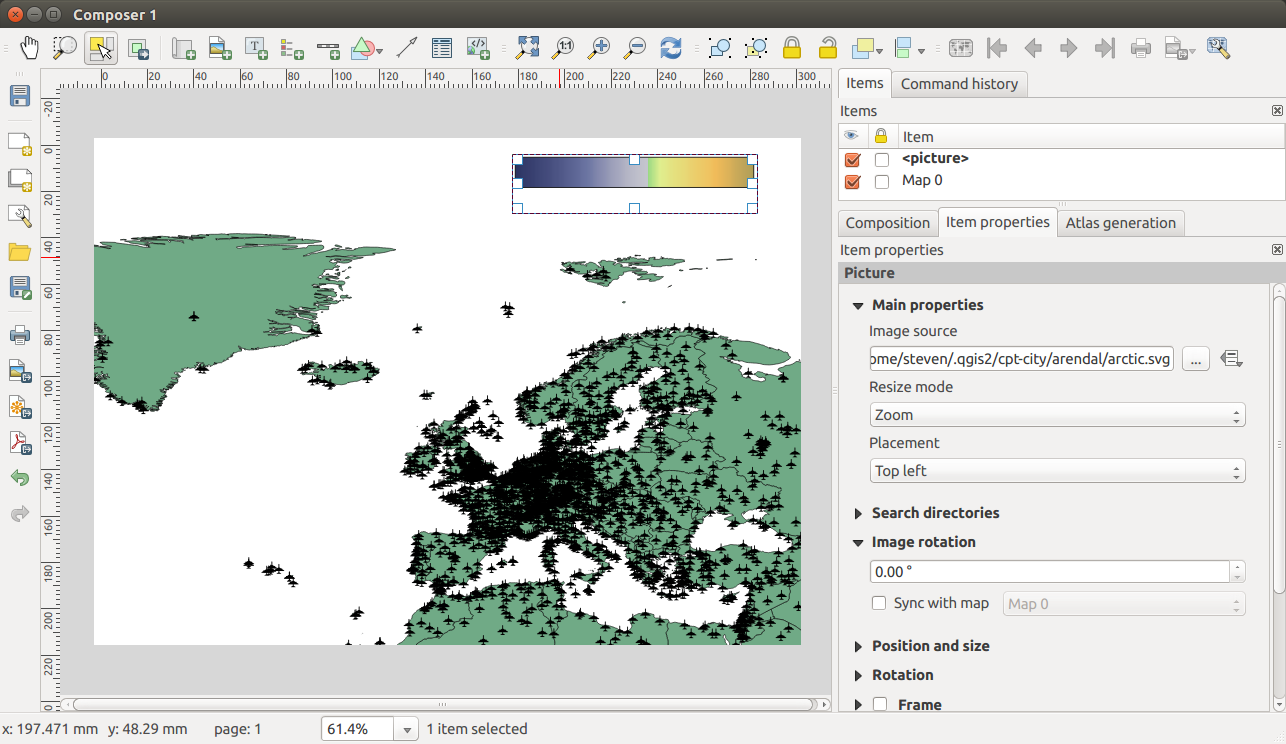
yet another option, but limited to the cpt-city ramps.

This works

  • if you have the Color Manager plugin installed and
  • you've elected to install the cpt-city ramps

You can drop the svg ramp file onto the canvas as an image. On my ubuntu setup they appear under ~/.qgis2/cpt-city/

enter image description here

3

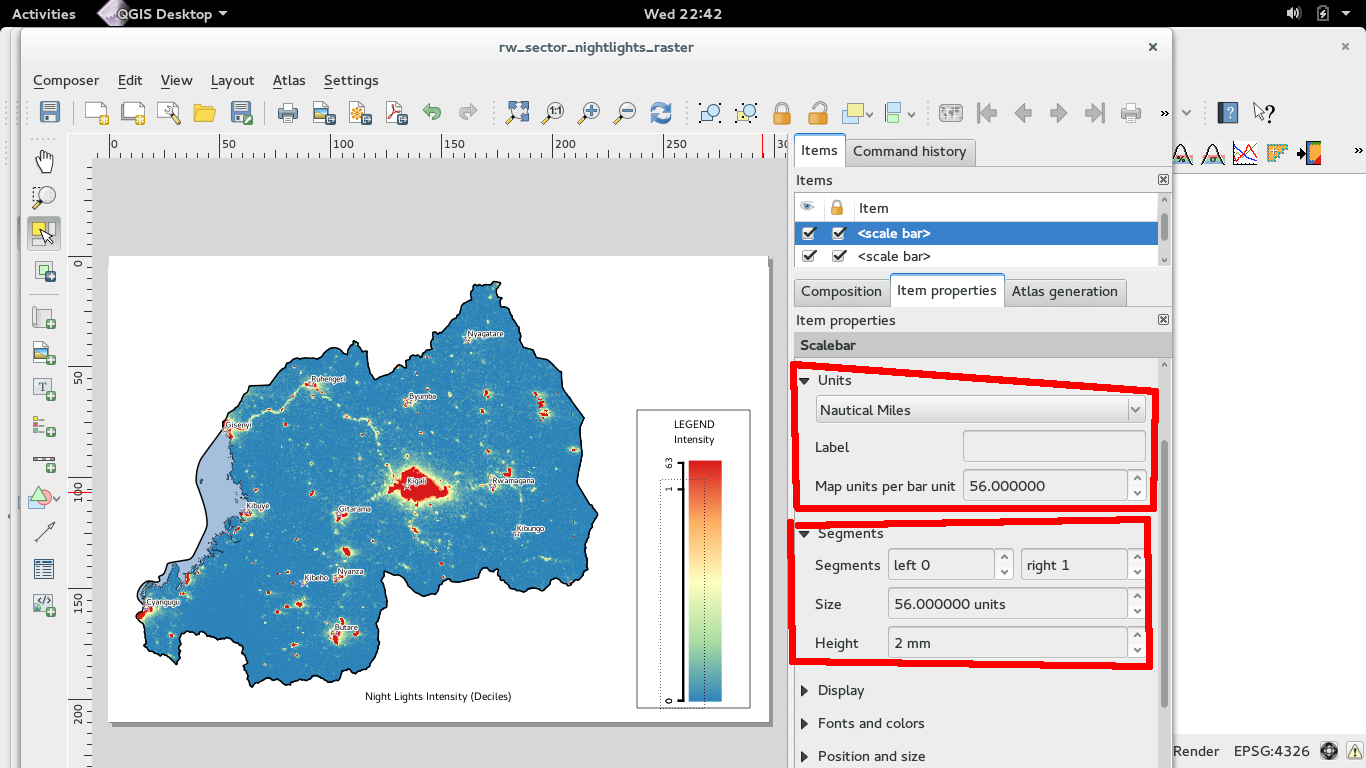
enter image description hereIn addition you might want to add a scale to your legend. You can do this by adding a scalebar. Play around with the units and segments to get the extent and segments you need.

  1. Rotate the scale bar if need be to align it to your ramp.
  2. Remove the units label or put an appropriate label.This will work for linear equally spaced units. For non linear scales you can overlay multiple scale bars with different units and segments.

I am still figuring out how to rotate the text

1
  • This is the closest solution that I could consider, but it is still a hack. I wonder what was the reason to discontinue the One-Band Raster plugin?
    – Bogdan
    Commented Dec 2, 2015 at 21:34

Your Answer

By clicking “Post Your Answer”, you agree to our terms of service and acknowledge you have read our privacy policy.

Not the answer you're looking for? Browse other questions tagged or ask your own question.