I'll try to make the mentioned approach more clear. The approach works with the polygon geometry features.
Diagrams is just the graphic overlay to a vector layer. It does not have any geometry or feature properties. After creating diagrams, you still work with the same layer, but with the data styling.
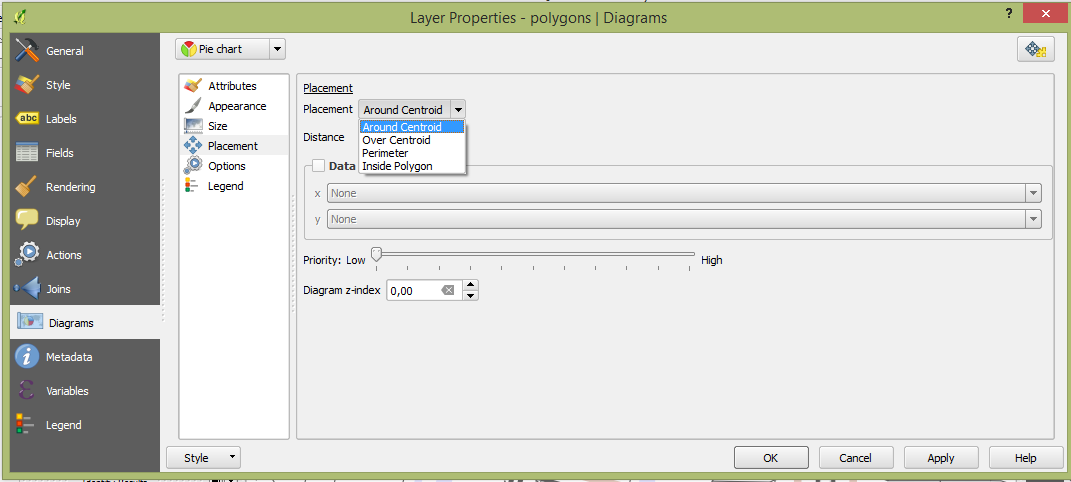
While using diagrams you often meet the overlapping problem. You may try to use different options in 'Placement' menu in Diagrams Toolbar, however it not always help.

The most common way to place diagrams would be 'Over Centroid', so it saves the spatial reference to every feature. However, it in 90% of cases you would meet the overlapping problem. @Micha proposes to move just some diagrams instead of trying to use other 'Placement' options which usually don't save the direct spatial reference: "let's build diagrams not for polygons, but for points which have the same position and attributes, and if some diagram overlaps, we would move it a bit within its polygon, so it would save the spatial reference".
There are following steps:
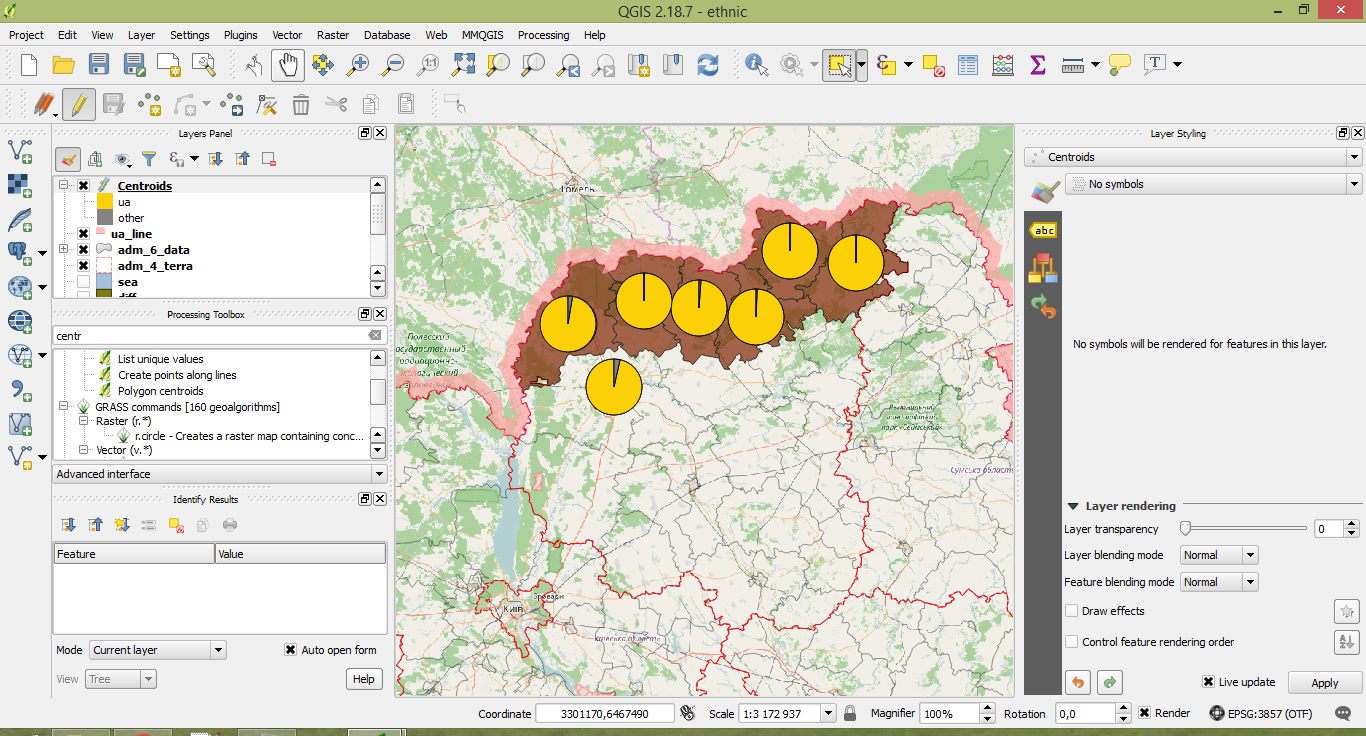
- Create polygon centroids (Processing Toolbox -> Polygon Centroids). We are getting new shapefile with points. Ok, we have got points with the same data as polygons have and they are in the position of the geometry centre of each feature (exactly where diagrams with 'Over Centroid' placement would be rendered)
- Create diagrams for new (points) shapefile with 'Over Centroid' Placement. Choose the 'No Symbol' option in the Style toolbar, so nobody understands our "trick", in case you're using some transparency for the diagrams (you still may need it for moving your features).

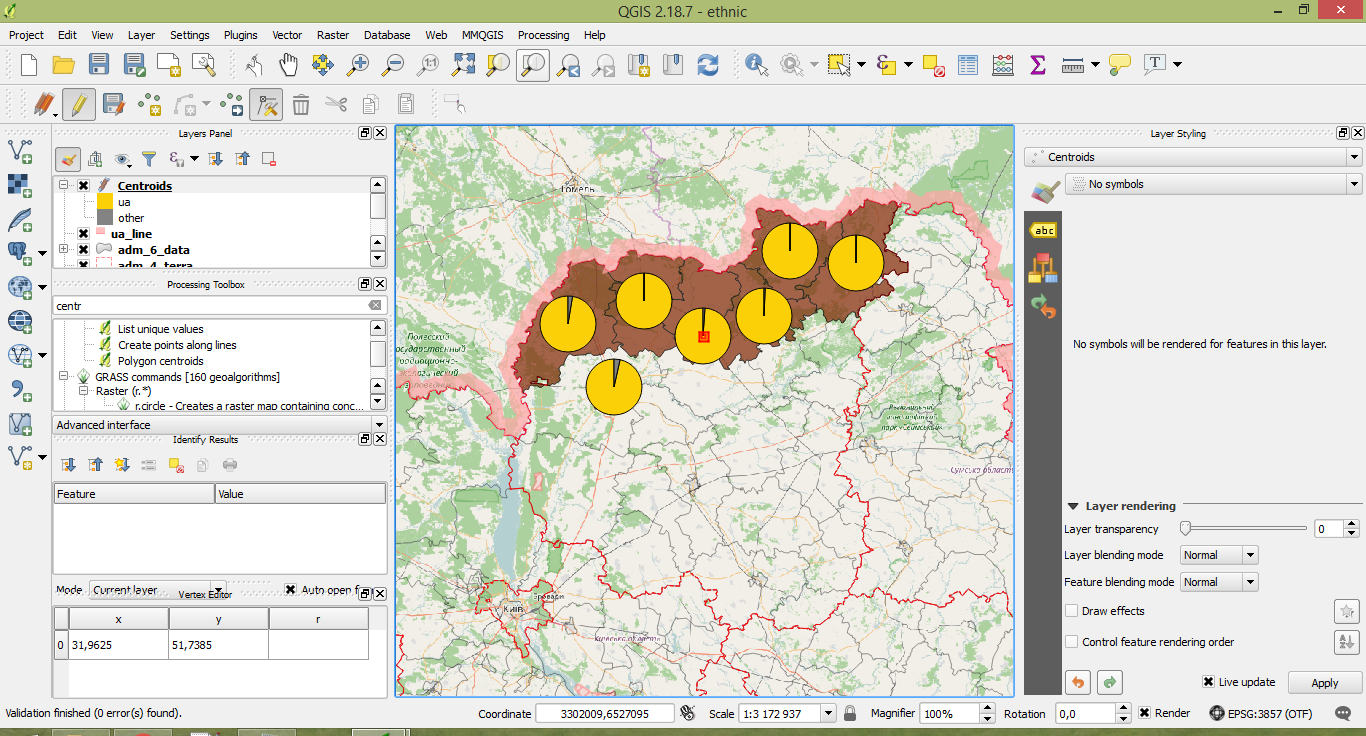
- Move your points features for creating your map with no overlaps just by editing your points layer. Not the most representative screenshot, sorry.

Be carefull while working with polygons with curve geometry or ones with the 'ring' geometry for not confusing the appropriate point. You may use labels for be sure you're using the correct point to move.


