11

A couple of years ago I posted The International Date Line wrap around and @jdeolive suggested I split the features at the dateLine. So I tried.

When I try to split my satellite track with splitWith on the dateline i get back null. I know I'm splitting correctly because when I split on Greenwich line I get the expected results.

Anyone know how I can properly split a Linestring programmatically along the date line with OpenLayers? I seek example code if you have it.

I've tried wrapDateLine but it doesn't seem to be working on vector layers despite my vector layer being like this:

vectorLayer = new OpenLayers.Layer.Vector("GroundTracks", {
    renderers: ['Canvas', 'VML'],
    wrapDateLine: true}); // <-- shoud be wraping.
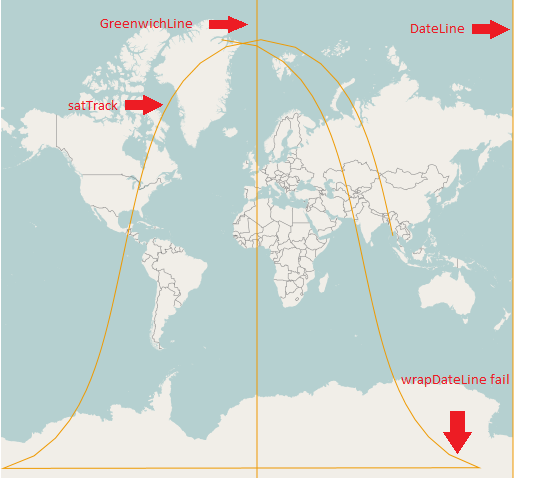
enter image description here

Here's my code:

var features = [];
var format = new OpenLayers.Format.WKT({
    'internalProjection': map.baseLayer.projection,
    'externalProjection': prjGeographic
});
var satTrack = format.read("LINESTRING (95.538611 13.286511, 94.730711 16.908947, 93.901095 20.528750, 93.043594 24.145177, 92.150978 27.757436, 91.214579 31.364666, 90.223791 34.965899, 89.165364 38.560019, 88.022401 42.145679, 86.772901 45.721205, 85.387568 49.284424, 83.826433 52.832413, 82.033480 56.361087, 79.927797 59.864504, 77.388419 63.333664, 74.227306 66.754285, 70.139140 70.102478, 64.605267 73.335774, 56.712904 76.373458, 44.881134 79.052803, 26.939886 81.047314, 02.704174 81.839241, -21.686285 81.101751, -39.887660 79.141947, -51.906937 76.480894, -59.912477 73.452897, -65.514482 70.225089, -69.645366 66.880243, -72.834535 63.461797, -75.393132 59.994131, -77.512464 56.491789, -79.315407 52.963919, -80.884039 49.416549, -82.275114 45.853820, -83.529088 42.278691, -84.675583 38.693355, -85.736827 35.099503, -86.729876 31.498490, -87.668095 27.891443, -88.562176 24.279331, -89.420849 20.663020, -90.251389 17.043303, -91.059999 13.420926, -91.852092 09.796602, -92.632515 06.171020, -93.405728 02.544857, -94.175960 -01.081217, -94.947343 -04.706542, -95.724045 -08.330456, -96.510402 -11.952298, -97.311065 -15.571400, -98.131162 -19.187081, -98.976502 -22.798638, -99.853829 -26.405335, -100.771148 -30.006378, -101.738172 -33.600889, -102.766925 -37.187866, -103.872602 -40.766117, -105.074803 -44.334175, -106.399366 -47.890158, -107.881153 -51.431559, -109.568417 -54.954914, -111.529886 -58.455253, -113.866668 -61.925160, -116.733085 -65.353081, -120.374635 -68.720132, -125.199754 -71.993642, -131.916790 -75.113368, -141.772276 -77.960803, -156.750096 -80.294831, -178.475596 -81.673196, 156.248392 -81.611421, 135.042323 -80.136505, 120.556535 -77.748172, 111.014840 -74.872356, 104.485504 -71.737081, 99.775637 -68.454400, 96.208126 -65.081545, 93.391438 -61.649716, 91.089380 -58.177038, 89.152970 -54.674643, 87.484294 -51.149703, 86.016609 -47.607042, 84.702947 -44.050030, 83.509299 -40.481112, 82.410411 -36.902133, 81.387093 -33.314533, 80.424442 -29.719485, 79.510644 -26.117981, 78.636145 -22.510889, 77.793053 -18.898997, 76.974710 -15.283040, 76.175371 -11.663718, 75.389950 -08.041709, 74.613831 -04.417680, 73.842693 -00.792294, 73.072378 02.833789, 72.298749 06.459907, 71.517566 10.085391, 70.724342 13.709564, 69.914194 17.331733, 69.081655 20.951185, 68.220447 24.567170, 67.323194 28.178891, 66.381031 31.785476, 65.383084 35.385943, 64.315735 38.979152, 63.161579 42.563725, 61.897893 46.137940, 60.494337 49.699551, 58.909396 53.245525, 57.084691 56.771602, 54.935577 60.271560, 52.334964 63.735923, 49.084320 67.149569, 44.859585 70.487030, 39.107498 73.702694, 30.852243 76.709182, 18.420695 79.329532, -00.339911 81.212453, -25.028018 81.831766)");

var featGreenwichLine = format.read("LINESTRING(0 -89, 0 89)");
var featDateLine = format.read("LINESTRING(180 -89, 180 89)");

features.push(featGreenwichLine);
features.push(featDateLine);
features.push(satTrack);

var resultsGreenwich = satTrack.geometry.splitWith(featGreenwichLine.geometry);
var resultsDateLine = satTrack.geometry.splitWith(featDateLine.geometry);

console.log(resultsGreenwich); //<--RETURNS EXPECTED RESULTS.
console.log(resultsDateLine);//<--RETURNS NULL.

vectorLayer.addFeatures(features);

My question is not a duplicate of this question because they want to know how to do it in ogr2ogr

Update:

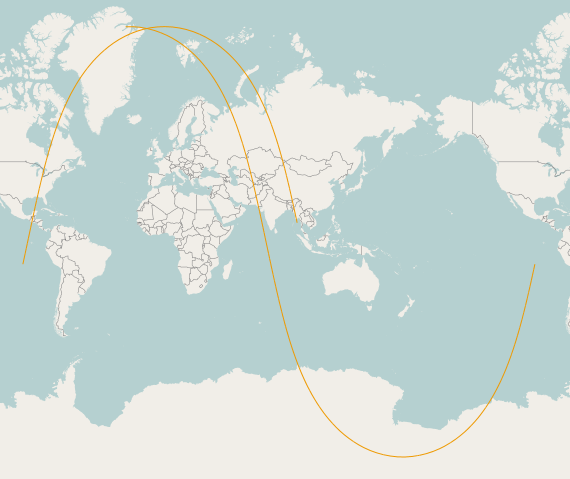
This is what a typical dataset I work with looks like (24 hour satellite track): The Linestring wkt can be found HERE.

enter image description here

7
  • What version of openlayers are you using?
    – Plux
    Commented Jan 21, 2014 at 15:18
  • @Plux 2.13.1 (Lastest)
    – CaptDragon
    Commented Jan 21, 2014 at 15:21
  • 1
    According to their API, wrapDateLine should only be used on the base layer, so it's no wonder it does not work on the vector layer. However, I have no idea how to make it work on the vector layer. I'm having a similar issue myself with multipolygons that crosses the dateline.
    – Plux
    Commented Jan 21, 2014 at 16:01
  • 1
    @Plux check out my solution
    – CaptDragon
    Commented Jan 21, 2014 at 20:58
  • Nice solution. It's unfortunately not applicable to my problem, I believe my problem is more on the geoserver-side, and my polygon contains coordinates that are on the "other side" of the dateline, like -180.00000000000003 90.00000190734869 which creates some issues in geoserver I believe. I'm not having issues displaying this on my map (I have a wms that does this), but I want to use these as filterboxes on a wfs-query to geoserver :)
    – Plux
    Commented Jan 22, 2014 at 9:21

4 Answers 4

2
+50

The problem is that your feature doesn't cross the date line from OpenLayers perspective, so your split line doesn't intersect your feature. Example from your data:

..., -178.475596 -81.673196, 156.248392 -81.611421,...

You go from -178 to 156, and this doesn't cross the date line from the OpenLayers perspective. Instead of splitting on the date line, you should split on your minimum X value.

// Build the splitting line based on the min and max coordinates of the vector to split
var minX = 999999999;
var minY = -20037508.34 // minimum value of the spherical mercator projection
var maxY = 20037508.34  // maximum value of the spherical mercator projection
//Extract the minimum X from the data as bounds seems to be rounded.
for(var i=0; i<satTrack.geometry.components.length; i++) {
    if(satTrack.geometry.components[i].x < minX)
        minX = satTrack.geometry.components[i].x;
}
var pointList = [
    new OpenLayers.Geometry.Point(minX, minY),
    new OpenLayers.Geometry.Point(minX, maxY)
];
var featDateLine = new OpenLayers.Feature.Vector(
    new OpenLayers.Geometry.LineString(pointList)
);

I've built an example here that successfully split your satellite track in 2 features: http://jsfiddle.net/6XJ5A/

Now to use the WKT with multiple line in your update, instead of using a straight line, you must go through the whole dataset and build your split line with all the coordinates that go across the dateline. By building small line inside a multiline, you can split on all the coordinates that should go across the dateline. Here's the updated example: http://jsfiddle.net/Jc274/

And the code:

// Build the splitting line based on the min and max coordinates of the vector to split
var pointList = [];
var lastPoint = satTrack.geometry.components[0];
//Extract the minimum X from the data as bounds seems to be rounded.
for (var i = 1; i < satTrack.geometry.components.length; i++) {
    if (Math.abs(satTrack.geometry.components[i].x - lastPoint.x) > 10000000) {
        pointList.push(satTrack.geometry.components[i]);
    }
    lastPoint = satTrack.geometry.components[i];
}

var lineList = [];
for(var i=0; i<pointList.length; i++) {
    lineList.push(new OpenLayers.Geometry.LineString([
        new OpenLayers.Geometry.Point(pointList[i].x, pointList[i].y-0.00001), 
        new OpenLayers.Geometry.Point(pointList[i].x, pointList[i].y+0.00001)
    ]));
}

var featDateLine = new OpenLayers.Feature.Vector(
new OpenLayers.Geometry.MultiLineString(lineList), null, split_style);

This will return you a splitted line on all the points that "cross" the dateline

Note that I also loop through the coordinates to remove the line that goes across the map to connect the 2 coordinates:

for (var i = 0; i < resultsDateLine.length; i++) {
    // Remove the first (or last) point of the line, the one that cross the dateline
    if (Math.abs(resultsDateLine[i].components[0].x - resultsDateLine[i].components[1].x) > 10000000) {
        resultsDateLine[i].removeComponent(resultsDateLine[i].components[0]);
    }
    if (Math.abs(resultsDateLine[i].components[resultsDateLine[i].components.length - 1].x - resultsDateLine[i].components[resultsDateLine[i].components.length - 2].x) > 10000000) {
        resultsDateLine[i].removeComponent(resultsDateLine[i].components[resultsDateLine[i].components.length - 1]);
    }
    features.push(new OpenLayers.Feature.Vector(resultsDateLine[i], null, style_array[i]));
}

Update: I updated the first example to only add the line that were split. I also updated the explanation accordingly. This approach is not bullet proof with the 24h satellite track you provided, but I'm working on it.

Update 2: I updated the second example. By using a multiline to split and looping through the result to remove extra coordinates added by the split, we get a set of features that never go across the dateline.

4
  • +1 for effort, but your map examples don't seem to solve the problem. The satellite tracks on your example map still cross the entire globe instead of taking following the natural path of the satellite track. I must be missing something?
    – CaptDragon
    Commented Jan 21, 2014 at 16:49
  • You might be misunderstanding the problem because ..., -178.475596 -81.673196, 156.248392 -81.611421,... absolutely crosses the dateline. See here
    – CaptDragon
    Commented Jan 21, 2014 at 17:01
  • Let me update the code and my explanation. I know it should cross the data line, but OpenLayers doesn't support this. From OL point of view, it's not crossing the dateline. Commented Jan 21, 2014 at 18:14
  • That's right. That's the problem. I'll need to trick OpenLayers and split the line so that it goes right up to the edge then continues on the other side where it's supposed to.
    – CaptDragon
    Commented Jan 21, 2014 at 18:30
2

I found a great solution on @Dane 's github. It's called Arc.js and it's for calculating Great circle routes. Not only that, it will also split the line on the dateline and provide you with two linestrings that meet at the dateline, which OpenLayers can easily map. I hope he comes forward to claim the bounty.

Here are my results:

enter image description here enter image description here

1

The splitWith function doesn't know about the earth's 3-dimensional shape. It only operates in a 2-dimensional world. In your case, all of your LINESTRING X coordinates are between -180 and 180. So from OpenLayers' two-dimensional perspective, the line string never actually does cross your split geometry (the date line) and it tells you so by returning null.

I believe that you're going to have to write some custom code to do the splitting. I'm imagining an algorithm that loops over your vertices, building output line strings like this:

  • For each adjacent pair of vertices decide if the segment between them crosses the date line.
  • If it doesn't, keep that segment like it is and add it to the "current" output line string.
  • If it does, split the segment into two parts. Add one part to the "current" line string, start a new "current" line string, and add the other part to this new one.

One reasonable heuristic for determining if a pair of vertices crosses the date line is to see if the difference between the X coordinates is more than 180 degrees. (Though this can get it wrong, for example, in the polar regions. Maybe you're lucky enough to not have any really high latitudes.)

The operation of splitting a segment into two parts could be as simple as linear interpolation (if you don't care too much about the track's accuracy). When you detect that the segment crosses the date line you make a copy of the second vertex and move its X coordinate (by adding or subtracting 360 degrees) then interpolate the Y coordinate.

EDIT: Here's a JSFiddle that demonstrates the above algorithm on your data: http://jsfiddle.net/85vjS/

0

If it works with Greenwich, this is because you are inside the bounds of your CRS. So I would first suggest the same workaround as in the post that you are pointing to :

var featDateLine = format.read("LINESTRING(179.99 -89, 179.99 89)");

and maybe

var featDateLine = format.read("LINESTRING(-179.99 -89, -179.99 89)");

for the other side .

Another solution is to work in a CRS that is not "out of bound" at the dateline. You should then be able to split your data without problem.

1
  • I've already tried both LINESTRING(179.99 -89, 179.99 89) and LINESTRING(-179.99 -89, -179.99 89) to no avail . Regarding the CRS, unfortunately, This won't work for my purpose because I'm mapping Satellite tracks which go around the world many times. So all CRS's are split somewhere and I'll have the same issue anywhere I split it. Thanks for your input.
    – CaptDragon
    Commented Jan 21, 2014 at 15:10

Your Answer

By clicking “Post Your Answer”, you agree to our terms of service and acknowledge you have read our privacy policy.

Not the answer you're looking for? Browse other questions tagged or ask your own question.