added 153 characters in body
Source Link
Pat
  • 41
  • 3

Apologies if this has been answered elsewhere. I have tried for several days now to come up with a solution to this problem, but haven't found an exact answer that applies to my current situation (or at least one that I could understand enough to implement myself).

I am trying to extract the percent of particular drainage areas that are covered by different surficial geologies (i.e. sand, silt, bedrock, etc.). I have shape files for almost 100 catchment areas (some overlap each other due to being sub-watersheds of larger river systems). I also have a shape file of surficial geology.

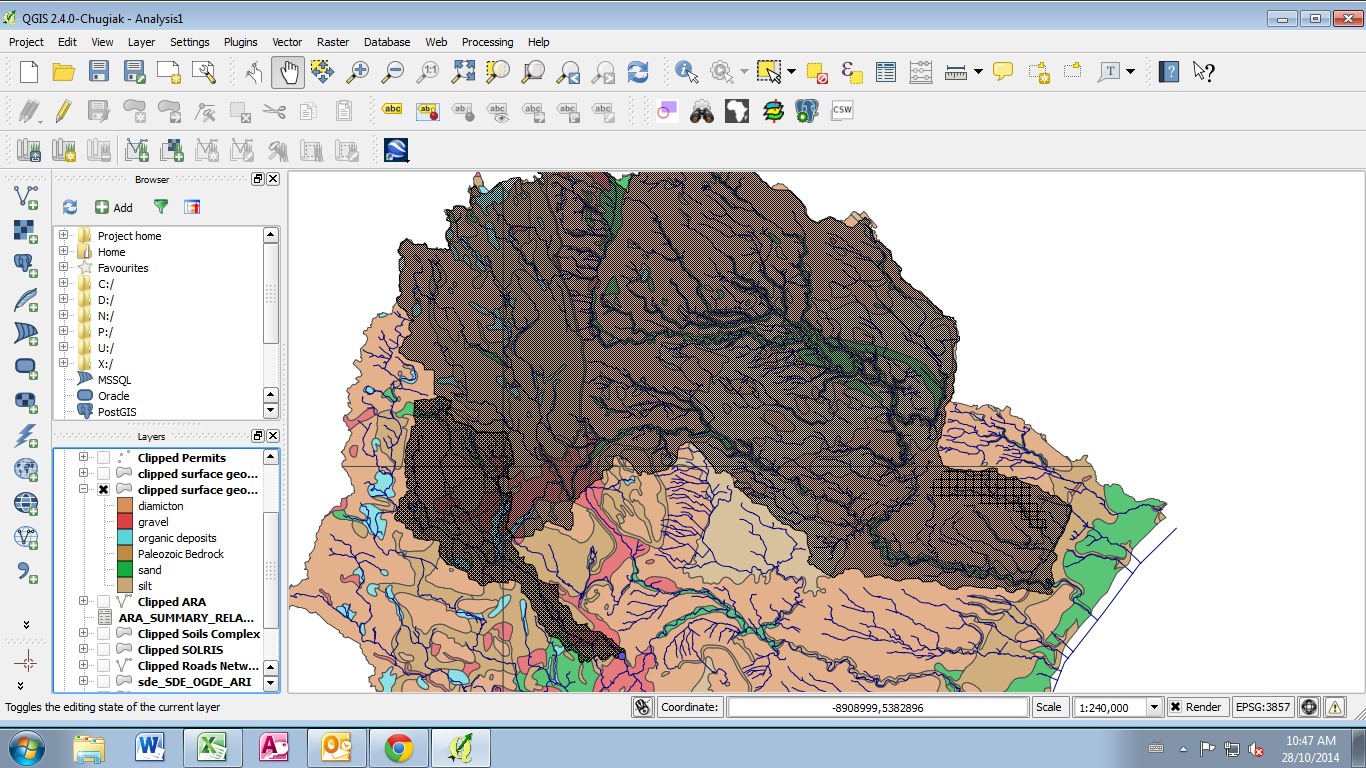
Below are some images to help illustrate: The first is what the catchment areas look like. The second is the geology layer with 3 catchments displayed over top (note the nestedness).Finally, I am looking to produce a table of percentages with catchments against geological features.
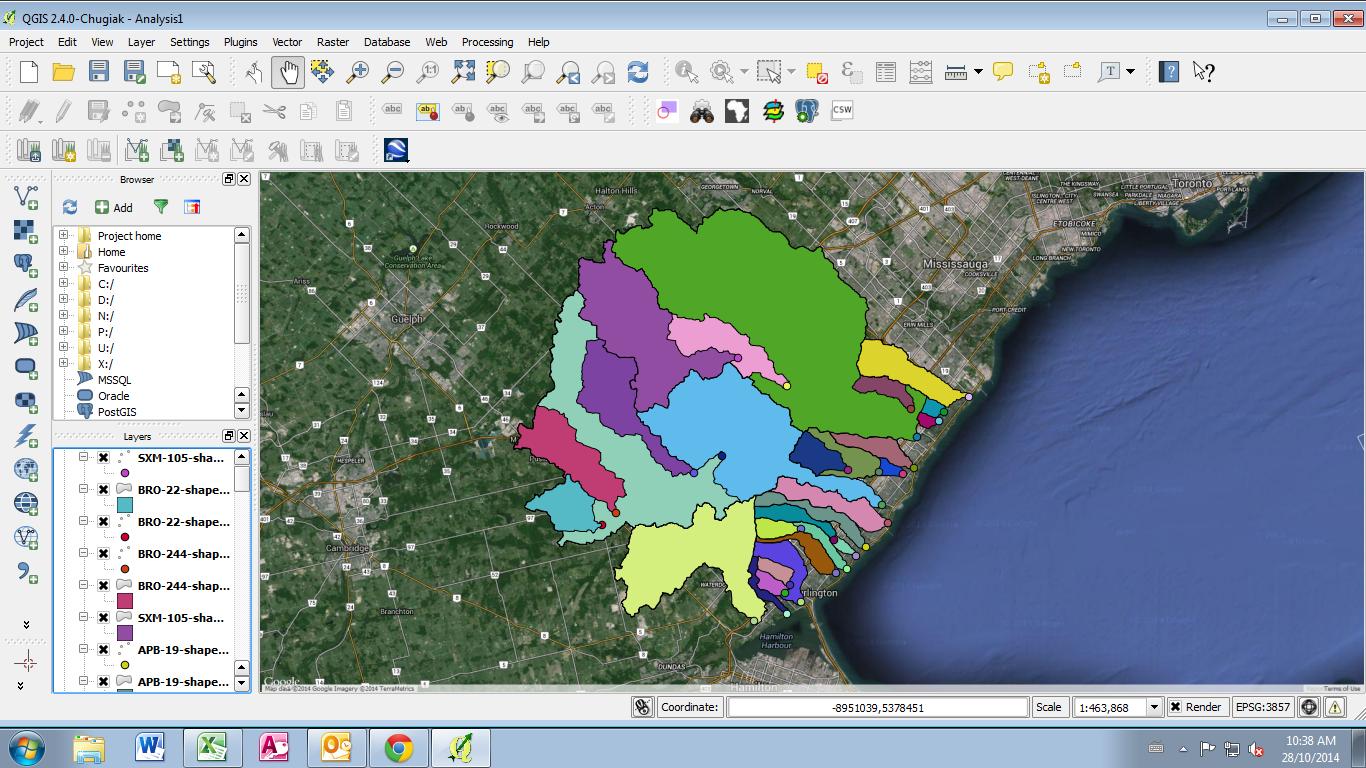
This is what the catchment areas look like

This is the geology layer with 3 catchments displayed over top

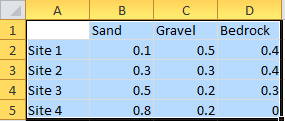
Basically, I am looking to produce a table with catchment areas against geological features:

Right now I am only using QGIS, but am open to trying other programs as well. I have used R in the past, but am not very good at python.

EDIT: the result of using union on the geology and catchment layers:

enter image description here

Apologies if this has been answered elsewhere. I have tried for several days now to come up with a solution to this problem, but haven't found an exact answer that applies to my current situation (or at least one that I could understand enough to implement myself).

I am trying to extract the percent of particular drainage areas that are covered by different surficial geologies (i.e. sand, silt, bedrock, etc.). I have shape files for almost 100 catchment areas (some overlap each other due to being sub-watersheds of larger river systems). I also have a shape file of surficial geology.

Below are some images to help illustrate: The first is what the catchment areas look like. The second is the geology layer with 3 catchments displayed over top (note the nestedness).Finally, I am looking to produce a table of percentages with catchments against geological features.
This is what the catchment areas look like

This is the geology layer with 3 catchments displayed over top

Basically, I am looking to produce a table with catchment areas against geological features:

Right now I am only using QGIS, but am open to trying other programs as well. I have used R in the past, but am not very good at python.

EDIT: the result of using union on the geology and catchment layers:
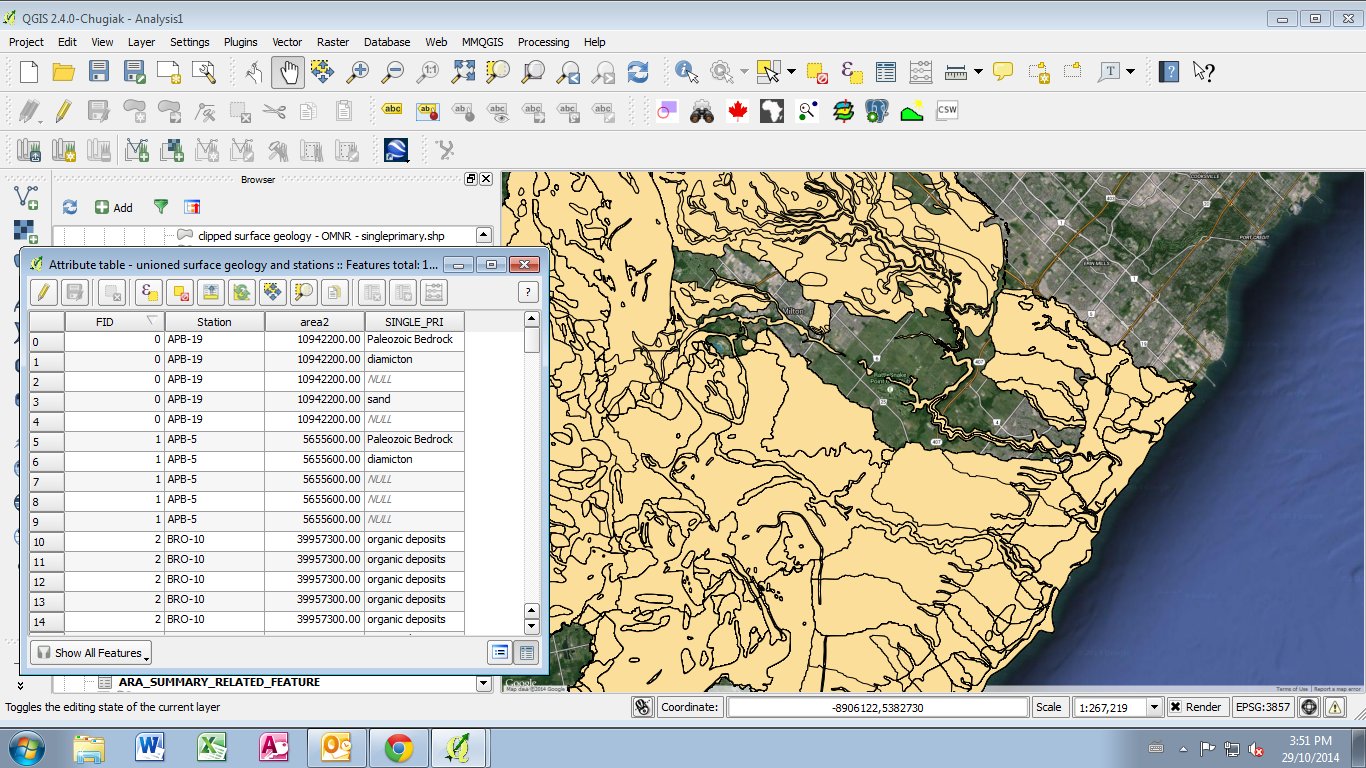
enter image description here

Source Link
Pat
  • 41
  • 3

Percent cover from overlapping shapefiles

Apologies if this has been answered elsewhere. I have tried for several days now to come up with a solution to this problem, but haven't found an exact answer that applies to my current situation (or at least one that I could understand enough to implement myself).

I am trying to extract the percent of particular drainage areas that are covered by different surficial geologies (i.e. sand, silt, bedrock, etc.). I have shape files for almost 100 catchment areas (some overlap each other due to being sub-watersheds of larger river systems). I also have a shape file of surficial geology.

Below are some images to help illustrate: The first is what the catchment areas look like. The second is the geology layer with 3 catchments displayed over top (note the nestedness).Finally, I am looking to produce a table of percentages with catchments against geological features.

This is what the catchment areas look like

This is the geology layer with 3 catchments displayed over top

Basically, I am looking to produce a table with catchment areas against geological features:

Right now I am only using QGIS, but am open to trying other programs as well. I have used R in the past, but am not very good at python.