I've built a web map that shows the locations of fleet vehicles based on their GPS data. I managed to add a nice feature that animates the routes these vehicles take on their way to destinations using SVG paths generated from street network data, however there is an issue with how the route graphics display after panning or zooming the map. Route calculations happen on my server-side app and are broadcast to my client app each time the vehicle updates its location. The first time a route line is drawn it looks correct for the current map scale, but if I zoom in the route line will look "clipped" or broken.
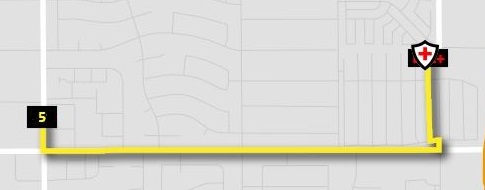
Here is an example of a route after the initial draw and animation. Imagine the yellow line originating from the black "5" graphic and snaking over to the red cross icon.

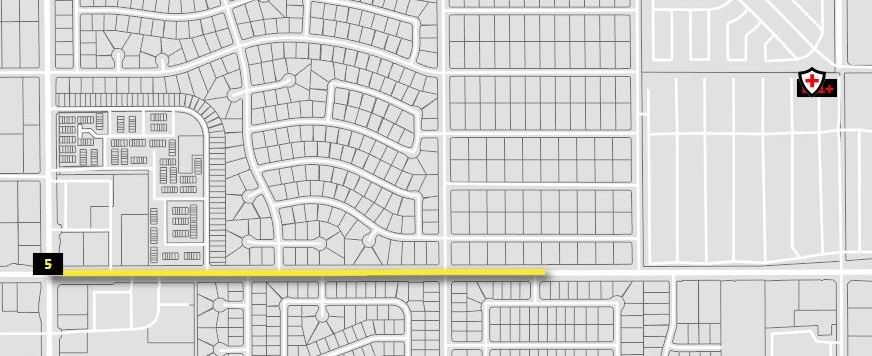
Here is the same route graphic a moment later zoomed in one level:

If I were to stay at that scale the line would never fully draw. Only after quickly zooming out and then in does the graphic "fix" itself and fully display. This issue is present whether I have SVG path animation on or not.
I believe this has something to do with how the SVG viewport is initially set and then not updated on a map scale change. One obvious quirk is that if a route graphic should be shown but it happens to be off the visible portion of the map it will not be visible even when the map is panned to that route location. Only after zooming in and out will the graphic finally render. I hope someone can offer a solution for making sure the route lines are refreshed and visible after scale changes. I will post some of the graphics code and what I've already tried. For the record I'm using ESRI JavaScript api v3.14 with Dojo v1.10.4 and testing on Chrome. My path animations were originally set only in CSS but I have tried Snap.svg for comparison and the added benefit of IE11 SVG support.
//Initialize ESRI graphics layer
routeLayer = new GraphicsLayer();

//My "RouteMaker" script handles getting new coordinates and creating the graphic...
var coordinates = routeObj.coords;
var routeLine = new Polyline(coordinates);
var sls = new SimpleLineSymbol('STYLE_SOLID', routeColor, 5);
this.graphicRoute = new Graphic(routeLine, sls);

//...which is then added to the graphics layer
var newRoute = new RouteMaker(routeObj);
routeLayer.add(newRoute.graphicRoute);

//Prior to rendering the route graphic I use the 'graphic-node-add' event to add
//shadow filter and svg animation. Here I am using Snap.svg to animate the line
var filter = filters.createFilter({x:"0", y:"0", width:"120%", height:"120%"},
    [
        filters.feGaussianBlur({"in":"SourceAlpha","stdDeviation":4}),
        filters.feOffset({"dx":5,"dy":5,"result":"offsetBlur"}),
        filters.feMerge("offsetBlur","SourceGraphic")
    ]);
routeLayer.on('graphic-node-add', function (evt) {
    var shape = evt.graphic.getShape();
    shape.setFilter(filter);

    var pathNode = evt.graphic.getNode();
    var snapPath = Snap(pathNode);
    var lenPath = snapPath.getTotalLength();
    snapPath.attr({
        'stroke-dasharray': lenPath + " " + lenPath,
        'stroke-dashoffset': lenPath
    }).animate({
        'stroke-dashoffset': 0
    }, 500);
});
//Alternatively I have tried leaving out Snap.svg and just using CSS, but the
//issue remains.
path {
    stroke-dasharray: 2500;
    stroke-dashoffset: 2500;
    animation: dash 5s linear forwards;
}
@keyframes dash {
    to {
        stroke-dashoffset: 0;
    }
}
//My attempt to force the route graphic to redraw. This seems to have no effect.
this.map.on('extent-change', function (evt) {
    console.log('map extent evt: ', evt);
    routeLayer.redraw();
});
Thanks for any ideas or suggestions!