I've seen that blog post too, and wondered the same thing!
You could use HTML Frames and the D3 library, if you don't mind doing a bit of JavaScript.
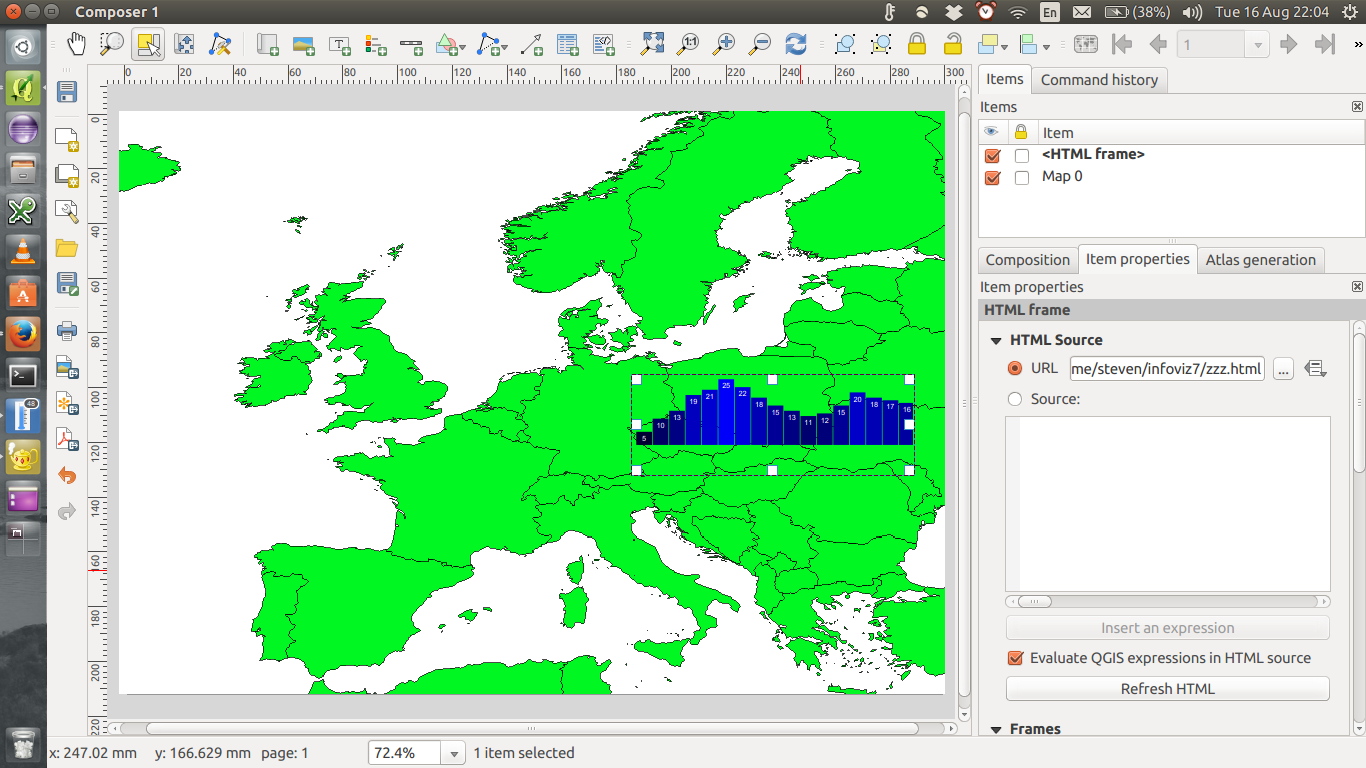
Here's an example which I hard-coded. You can insert QGIS Expressions into your page source (from QGIS 2.14 or later)
In my case, I've saved the html file locally and hacked it until I got it to display, using browser's developer tools.
Once you have it working, you should be able to paste the page source into the 'source' windowtext box directly, and drop QGIS expressions in (such as field values, variables etc.) using the Insert an expression button.
I cobbled together that example from alignedleft.com. This tutorial is useful as it shows how to build bar charts from simple lists; most examples I've seen use separate TSV files.
Bl.ocks.org has a very large set of examples.
You can get code for the AlignedLeft tutorials here on GitHub
This might make a good plugin... I see there are a couple of d3 plugins already, although I've not had a chance to try them - worth a look maybe?

