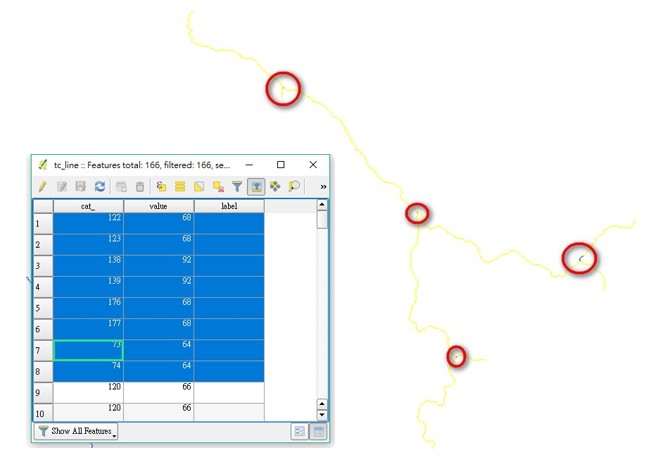
Originally, I had to manually select lines (these lines were lines upstream and around confluence point, as showed below) of the shapefile in QGIS and edited values in their rows in the attribute table. The figure below showed those lines (I used invert selection to mark them as little blue segments) and their rows in attribute table:

I want to make the whole process automatic, and recently, with Fiona and networkx, I also got some edges around confluence point in this shapefile (stored in numpy array) (How to get lines and nodes around the confluence point in a network system (line shapefile)?), and after some works, I obtained the following numpy array storing:
- coordinates of upstream edges (one row represents one edge) around confluence points (the figure above showed there were 4 confluences, so I got total of 8 coordinates of upstream edges (confluence_x,confluence_y in col.1 and col.2; node_x,node_y in col.3 and col.4))
- values I want to add in the rows containing those 8 edges in the attribute table (col.6)
Here's the numpy array:
LINESTRING[[ (260586 2.259674072360586260e+05 2736302  2.815605165,73630282e+06 260586  2.259674072360586260e+05 2736273  2.931404115)73627393e+06
LINESTRING (260586.2596740723 2736302.815605165, 260586 2.259674072341920287e+08 2736331  5.699806215)77421597e-01]
LINESTRING (260586[  2.259674072360586260e+05 2736302  2.815605165,73630282e+06 260615  2.143875122160615144e+05 2736302  2.815605165)73630282e+06
I want to:
1. Add a column (type:float) containing 1 in the attribute table of tc_line
2. In the table, find out rows (line segments), which contain edges listed above
3. Update value in the new-added column of selected rows
But now I got stuck in stage 2 described above. I wanted to find out lines (rows in the attribute table) containing edges above by setting those edges as condition statement, but I don't know how to construct the condition statement:
import itertools
from shapely  1.geometry77046181e+08 import Point, LineString4.22578403e-01]
import numpy

G[ = nx2.Graph()
for52209841e+05 line in fiona2.open('tc_line74407267e+06   2.shp'):52238726e+05   2.74407267e+06
    .5.04274178e+08   9.99998346e-01]
I am newbie to use Fiona and networkx, and how to solve this and achieve my objectives? I am glad to receive some tips.
I am working with python 2.7.12, Fiona 1.7.0 and networkx 1.11 under Win10 64bits.
UPDATE1
I tried to work out stage 2, and I took intersecting two shapefiles from Python or command line as reference and wrote the following script:
import sys,[ os
from shapely2.geometry52209841e+05 import mapping, shape
import2.74407267e+06 fiona
import networkx as2.52209841e+05 nx
import itertools 2.74404378e+06
from shapely   8.geometry34297070e+02 import Point, LineString1.65444856e-06]
import numpy

#copy[ and create2.63041417e+05 new shapefile
with fiona2.open('tc_line72726206e+06   2.shp',63041417e+05 'r') as input:2.72723318e+06
    schema1.89988632e+08 = input.schema 9.copy()10935725e-01]
 [  2.63041417e+05 input_crs = input2.crs
72726206e+06   2.63070301e+05 schema['properties']['pi'] = 'float'2.72726206e+06
    with1.85756243e+07 fiona  8.open('tc_pi90642751e-02]
 [  2.shp',70782383e+05 'w', 'ESRI Shapefile',2.73324109e+06 schema, input_crs) as2.70753498e+05 output:  2.73326997e+06
    5.63667787e+07   9.99955598e-01]
 for[ elem in2.70782383e+05 input:
  2.73324109e+06   2.70782383e+05   2.73321221e+06
    elem['properties']['pi']=2.50289121e+03 1  4.44016873e-05]]
So now all I need to do is using python to find out rows (line segments), which contain edges listed above, in the attribute table, and then update values in these rows. Obviously that the 8 edges were definitely contained by lines in the shapefile, so I wrote the following script:
import sys, os
import fiona
import networkx as nx
import itertools
import numpy
from shapely.geometry import Point, output.write({'properties':elem['properties']LineString,'geometry': mapping(, shape(elem['geometry']))})

G = nx.Graph()
for line in fiona.open('tc_pi'tc_line.shp'):
    for seg_start, seg_end in itertools.izip(line['geometry']['coordinates'],line['geometry']['coordinates'][1:]):
        G.add_edge(seg_start, seg_end)

#store edges around confluence point in numpy array
conflu = []
edge_node = []
for node in G.nodes_iter():
    if G.degree(node) > 2:
        for edge in G.edges(node):
            conflu.append(edge[0])
           print edge_node.append(edge[1])edge
conflu_set

abc = numpy.arraygenfromtxt(conflu)       'abc.csv', delimiter = ',')
i = 0
edge_node_setedges = numpy.array[LineString(edge_nodeedge)
edge_set =for numpynode,edge in itertools.hstackproduct(G.nodes_iter(conflu_set), edge_node_set G.edges(node))
print edge_set

#find rowsif G.degree(linesnode) contain edges
i => 02]
for line in fiona.open('tc_pi'tc_line.shp'):
    for edge in edges:
        while i < edge_setabc.shape[0]:
            print i
            print abc[i][:2], abc[i][2:4]
            if shape(line['geometry']).contains(LineString([edge_set[i][[abc[i][:2], edge_set[i][2abc[i][2:]]4]])):
                print line
            i = i + 1
The edge_set stored coordinates of edges around confluence pointI read the numpy array from abc.csv, but the script above outputs only one record, and it was strange:
[[0
[  260586.25967407  2736302.8156051681560516] [  260586.25967407  2736273.93140412]
 [  260586.25967407  2736302.81560516   260586.25967407  2736331.69980621]1
 [  260586.25967407  2736302.8156051681560516] [  260615.14387512  2736302.81560516]
 2
[  252209.84136963  2744072.6656875666568756] [  252238.72557068  2744072.66568756]
 [  252209.84136963  2744072.66568756   252209.84136963  2744101.54988861]
 [  252209.84136963  2744072.66568756   252209.84136963  2744043.78148651]
 [  263041.41676331  2727262.06067658   263041.41676331  2727233.17647553]
 [  263041.41676331  2727262.06067658   262983.64836121  2727319.82907868]
 [  263041.41676331  2727262.06067658   263070.30096436  2727262.06067658]
 [  270782.38264465  2733241.09029389   270753.4984436   2733269.97449494]
 [  270782.38264465  2733241.09029389   270811.2668457   2733241.09029389]
 [  270782.38264465  2733241.09029389   270782.38264465  2733212.20609284]]
and these edges were found from the same line shapefile, but the script above outputs only one record, and it was strange:
0
1
2
3
{'geometry': {'type': 'LineString', 'coordinates': [(252238.72557067798, 2744072.6656875624), (252209.84136962818, 2744072.6656875624)]}, 'type': 'Feature', 'id': '0', 'properties': OrderedDict([(u'cat_', 73L), (u'value', 64L), (u'label', None), (u'pi', 1.0)])}
4
5
6
7
8
9
10
11
I also tried if shape(line['geometry']).intersects(LineString([edge_set[i][:2], edge_set[i][2:]])):, but it outputted even weird result:
0
1
2
3
{'geometry': {'type': 'LineString', 'coordinates': [(252238.72557067798, 2744072.6656875624), (252209.84136962818,84136963  2744072.6656875624)]}, 'type': 'Feature', 'id': '0', 'properties':66568756] OrderedDict([(u'cat_', 73L), (u'value', 64L), (u'label', None),252209.84136963 (u'pi', 12744043.0)])}78148651]
4
{'geometry': {'type':[ 'LineString', 'coordinates': [(252238263041.72557067798,41676331 2744072.6656875624), (2522092727262.84136962818,06067658] 2744072.6656875624)]},[ 'type': 'Feature',263041.41676331 'id': '0',2727233.17647553]
5
[ 'properties': OrderedDict([(u'cat_',263041.41676331 73L), (u'value',2727262.06067658] 64L),[ (u'label', None),263070.30096436 (u'pi', 12727262.0)])}06067658]
56
{'geometry':[ {'type': 'LineString',270782.38264465 'coordinates': [(2522382733241.72557067798,09029389] 2744072.6656875624),[ (252209.84136962818, 2744072270753.6656875624)]},4984436 'type': 'Feature', 'id': '0',2733269.97449494]
7
[ 'properties': OrderedDict([(u'cat_',270782.38264465 73L), (u'value',2733241.09029389] 64L),[ (u'label', None),270782.38264465 (u'pi', 12733212.0)])}
6
7
8
9
10
1120609284]
How to use python to find out rows (line segments), which contain coordinates of the edges listed above, in the attribute table, and then update values in these rows?

