fixed misspellings
Source Link
ssanch
  • 341
  • 2
  • 4

The clue is building the SpatialLines object later, once you have a list of Lines objects. The ID MUST be unique, otherwise all your Lines objects will have the same ID, and SpatialLines will throw an error.

I prepared this example code to illustrate:

 library(sp)
 library(raster) # need a raster to generate fake data
 library(dismo)  # I'm using the "randomPoints" function from dismo
 
 # first we need a canvas
 # we can start with an arbitrary extent
 ext <- extent(-20,10,-10,0)
 r <- raster(ext) # this is our raster object
 r[] <- 1 # let's fill it up with 1's

 indiv <- LETTERS[1:5] # let's say we have 5 individuals with data
 df <- data.frame()
 # we are generating 10 random points per "individual"
 for (i in 1:5)
      df <- rbind(df,randomPoints(r, 10))
 # you will get a warning about the projection, ignore that.

 # with this we can generate a SpatialPointsDataFrame
 spdf <- SpatialPointsDataFrame(
              coords=as.matrix(df), 
              data=data.frame(ind=sort(rep(indiv,10))))

 # now we loop for each individual 
 # and store "Lines" objects in a list
 trajectories <- list()
 for (i in 1:length(indiv))
         trajectories[[i]] <- Lines(list(Line(subset(spdf, ind == indiv[i]))), 
                                    ID=paste(i))
 # pay close attention on how the Lines structureobject must be structured:
 # Lines(list(Line(spdf)), ID="unique string")

 # then we simply transform our trajectories list to SpatialLines
 splo <- SpatialLines(trajectories)

You can thethen visualize the data like this:

 image(r)
 plot(splo, add=T, col=rainbow(5))
 plot(spdf, add=T, pch=16, col=rainbow(5)[ spdf$ind ])

enter image description here

The clue is building the SpatialLines object later, once you have a list of Lines objects. The ID MUST be unique, otherwise all your Lines objects will have the same ID, and SpatialLines will throw an error.

I prepared this example code to illustrate:

 library(sp)
 library(raster) # need a raster to generate fake data
 library(dismo)  # I'm using the "randomPoints" function from dismo
 
 # first we need a canvas
 # we can start with an arbitrary extent
 ext <- extent(-20,10,-10,0)
 r <- raster(ext) # this is our raster object
 r[] <- 1 # let's fill it up with 1's

 indiv <- LETTERS[1:5] # let's say we have 5 individuals with data
 df <- data.frame()
 # we are generating 10 random points per "individual"
 for (i in 1:5)
      df <- rbind(df,randomPoints(r, 10))
 # you will get a warning about the projection, ignore that.

 # with this we can generate a SpatialPointsDataFrame
 spdf <- SpatialPointsDataFrame(
              coords=as.matrix(df), 
              data=data.frame(ind=sort(rep(indiv,10))))

 # now we loop for each individual 
 # and store "Lines" objects in a list
 trajectories <- list()
 for (i in 1:length(indiv))
         trajectories[[i]] <- Lines(list(Line(subset(spdf, ind == indiv[i]))), 
                                    ID=paste(i))
 # pay close attention on how the Lines structure must be structured:
 # Lines(list(Line(spdf)), ID="unique string")

 # then we simply transform our trajectories list to SpatialLines
 splo <- SpatialLines(trajectories)

You can the visualize the data like this:

 image(r)
 plot(splo, add=T, col=rainbow(5))
 plot(spdf, add=T, pch=16, col=rainbow(5)[ spdf$ind ])
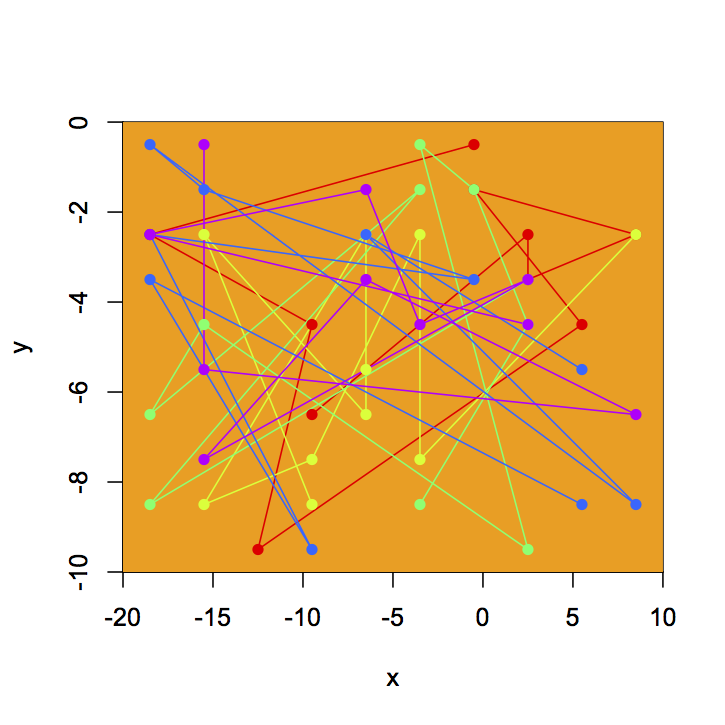
enter image description here

The clue is building the SpatialLines object later, once you have a list of Lines objects. The ID MUST be unique, otherwise all your Lines objects will have the same ID, and SpatialLines will throw an error.

I prepared this example code to illustrate:

 library(sp)
 library(raster) # need a raster to generate fake data
 library(dismo)  # I'm using the "randomPoints" function from dismo
 
 # first we need a canvas
 # we can start with an arbitrary extent
 ext <- extent(-20,10,-10,0)
 r <- raster(ext) # this is our raster object
 r[] <- 1 # let's fill it up with 1's

 indiv <- LETTERS[1:5] # let's say we have 5 individuals with data
 df <- data.frame()
 # we are generating 10 random points per "individual"
 for (i in 1:5)
      df <- rbind(df,randomPoints(r, 10))
 # you will get a warning about the projection, ignore that.

 # with this we can generate a SpatialPointsDataFrame
 spdf <- SpatialPointsDataFrame(
              coords=as.matrix(df), 
              data=data.frame(ind=sort(rep(indiv,10))))

 # now we loop for each individual 
 # and store "Lines" objects in a list
 trajectories <- list()
 for (i in 1:length(indiv))
         trajectories[[i]] <- Lines(list(Line(subset(spdf, ind == indiv[i]))), 
                                    ID=paste(i))
 # pay close attention on how the Lines object must be structured:
 # Lines(list(Line(spdf)), ID="unique string")

 # then we simply transform our trajectories list to SpatialLines
 splo <- SpatialLines(trajectories)

You can then visualize the data like this:

 image(r)
 plot(splo, add=T, col=rainbow(5))
 plot(spdf, add=T, pch=16, col=rainbow(5)[ spdf$ind ])

enter image description here

Changed typo (through to throw)
Source Link
ssanch
  • 341
  • 2
  • 4

The clue is building the SpatialLines object later, once you have a list of Lines objects. The ID MUST be unique, otherwise all your Lines objects will have the same ID, and SpatialLines will throughthrow an error.

I prepared this example code to illustrate:

 library(sp)
 library(raster) # need a raster to generate fake data
 library(dismo)  # I'm using the "randomPoints" function from dismo
 
 # first we need a canvas
 # we can start with an arbitrary extent
 ext <- extent(-20,10,-10,0)
 r <- raster(ext) # this is our raster object
 r[] <- 1 # let's fill it up with 1's

 indiv <- LETTERS[1:5] # let's say we have 5 individuals with data
 df <- data.frame()
 # we are generating 10 random points per "individual"
 for (i in 1:5)
      df <- rbind(df,randomPoints(r, 10))
 # you will get a warning about the projection, ignore that.

 # with this we can generate a SpatialPointsDataFrame
 spdf <- SpatialPointsDataFrame(
              coords=as.matrix(df), 
              data=data.frame(ind=sort(rep(indiv,10))))

 # now we loop for each individual 
 # and store "Lines" objects in a list
 trajectories <- list()
 for (i in 1:length(indiv))
         trajectories[[i]] <- Lines(list(Line(subset(spdf, ind == indiv[i]))), 
                                    ID=paste(i))
 # pay close attention on how the Lines structure must be structured:
 # Lines(list(Line(spdf)), ID="unique string")

 # then we simply transform our trajectories list to SpatialLines
 splo <- SpatialLines(trajectories)

You can the visualize the data like this:

 image(r)
 plot(splo, add=T, col=rainbow(5))
 plot(spdf, add=T, pch=16, col=rainbow(5)[ spdf$ind ])

enter image description here

The clue is building the SpatialLines object later, once you have a list of Lines objects. The ID MUST be unique, otherwise all your Lines objects will have the same ID, and SpatialLines will through an error.

I prepared this example code to illustrate:

 library(sp)
 library(raster) # need a raster to generate fake data
 library(dismo)  # I'm using the "randomPoints" function from dismo
 
 # first we need a canvas
 # we can start with an arbitrary extent
 ext <- extent(-20,10,-10,0)
 r <- raster(ext) # this is our raster object
 r[] <- 1 # let's fill it up with 1's

 indiv <- LETTERS[1:5] # let's say we have 5 individuals with data
 df <- data.frame()
 # we are generating 10 random points per "individual"
 for (i in 1:5)
      df <- rbind(df,randomPoints(r, 10))
 # you will get a warning about the projection, ignore that.

 # with this we can generate a SpatialPointsDataFrame
 spdf <- SpatialPointsDataFrame(
              coords=as.matrix(df), 
              data=data.frame(ind=sort(rep(indiv,10))))

 # now we loop for each individual 
 # and store "Lines" objects in a list
 trajectories <- list()
 for (i in 1:length(indiv))
         trajectories[[i]] <- Lines(list(Line(subset(spdf, ind == indiv[i]))), 
                                    ID=paste(i))
 # pay close attention on how the Lines structure must be structured:
 # Lines(list(Line(spdf)), ID="unique string")

 # then we simply transform our trajectories list to SpatialLines
 splo <- SpatialLines(trajectories)

You can the visualize the data like this:

 image(r)
 plot(splo, add=T, col=rainbow(5))
 plot(spdf, add=T, pch=16, col=rainbow(5)[ spdf$ind ])

enter image description here

The clue is building the SpatialLines object later, once you have a list of Lines objects. The ID MUST be unique, otherwise all your Lines objects will have the same ID, and SpatialLines will throw an error.

I prepared this example code to illustrate:

 library(sp)
 library(raster) # need a raster to generate fake data
 library(dismo)  # I'm using the "randomPoints" function from dismo
 
 # first we need a canvas
 # we can start with an arbitrary extent
 ext <- extent(-20,10,-10,0)
 r <- raster(ext) # this is our raster object
 r[] <- 1 # let's fill it up with 1's

 indiv <- LETTERS[1:5] # let's say we have 5 individuals with data
 df <- data.frame()
 # we are generating 10 random points per "individual"
 for (i in 1:5)
      df <- rbind(df,randomPoints(r, 10))
 # you will get a warning about the projection, ignore that.

 # with this we can generate a SpatialPointsDataFrame
 spdf <- SpatialPointsDataFrame(
              coords=as.matrix(df), 
              data=data.frame(ind=sort(rep(indiv,10))))

 # now we loop for each individual 
 # and store "Lines" objects in a list
 trajectories <- list()
 for (i in 1:length(indiv))
         trajectories[[i]] <- Lines(list(Line(subset(spdf, ind == indiv[i]))), 
                                    ID=paste(i))
 # pay close attention on how the Lines structure must be structured:
 # Lines(list(Line(spdf)), ID="unique string")

 # then we simply transform our trajectories list to SpatialLines
 splo <- SpatialLines(trajectories)

You can the visualize the data like this:

 image(r)
 plot(splo, add=T, col=rainbow(5))
 plot(spdf, add=T, pch=16, col=rainbow(5)[ spdf$ind ])

enter image description here

added 1 character in body
Source Link
ssanch
  • 341
  • 2
  • 4

The clue is building the SpatialLines object later, once you have a list of Lines objects. The ID MUST be unique, otherwise all youyour Lines objects will have the same ID, and SpatialLines will through an error.

I prepared this example code to illustrate:

 library(sp)
 library(raster) # need a raster to generate fake data
 library(dismo)  # I'm using the "randomPoints" function from dismo
 
 # first we need a canvas
 # we can start with an arbitrary extent
 ext <- extent(-20,10,-10,0)
 r <- raster(ext) # this is our raster object
 r[] <- 1 # let's fill it up with 1's

 indiv <- LETTERS[1:5] # let's say we have 5 individuals with data
 df <- data.frame()
 # we are generating 10 random points per "individual"
 for (i in 1:5)
      df <- rbind(df,randomPoints(r, 10))
 # you will get a warning about the projection, ignore that.

 # with this we can generate a SpatialPointsDataFrame
 spdf <- SpatialPointsDataFrame(
              coords=as.matrix(df), 
              data=data.frame(ind=sort(rep(indiv,10))))

 # now we loop for each individual 
 # and store "Lines" objects in a list
 trajectories <- list()
 for (i in 1:length(indiv))
         trajectories[[i]] <- Lines(list(Line(subset(spdf, ind == indiv[i]))), 
                                    ID=paste(i))
 # pay close attention on how the Lines structure must be structured:
 # Lines(list(Line(spdf)), ID="unique string")

 # then we simply transform our trajectories list to SpatialLines
 splo <- SpatialLines(trajectories)

You can the visualize the data like this:

 image(r)
 plot(splo, add=T, col=rainbow(5))
 plot(spdf, add=T, pch=16, col=rainbow(5)[ spdf$ind ])

enter image description here

The clue is building the SpatialLines object later, once you have a list of Lines objects. The ID MUST be unique, otherwise all you Lines objects will have the same ID, and SpatialLines will through an error.

I prepared this example code to illustrate:

 library(sp)
 library(raster) # need a raster to generate fake data
 library(dismo)  # I'm using the "randomPoints" function from dismo
 
 # first we need a canvas
 # we can start with an arbitrary extent
 ext <- extent(-20,10,-10,0)
 r <- raster(ext) # this is our raster object
 r[] <- 1 # let's fill it up with 1's

 indiv <- LETTERS[1:5] # let's say we have 5 individuals with data
 df <- data.frame()
 # we are generating 10 random points per "individual"
 for (i in 1:5)
      df <- rbind(df,randomPoints(r, 10))
 # you will get a warning about the projection, ignore that.

 # with this we can generate a SpatialPointsDataFrame
 spdf <- SpatialPointsDataFrame(
              coords=as.matrix(df), 
              data=data.frame(ind=sort(rep(indiv,10))))

 # now we loop for each individual 
 # and store "Lines" objects in a list
 trajectories <- list()
 for (i in 1:length(indiv))
         trajectories[[i]] <- Lines(list(Line(subset(spdf, ind == indiv[i]))), 
                                    ID=paste(i))
 # pay close attention on how the Lines structure must be structured:
 # Lines(list(Line(spdf)), ID="unique string")

 # then we simply transform our trajectories list to SpatialLines
 splo <- SpatialLines(trajectories)

You can the visualize the data like this:

 image(r)
 plot(splo, add=T, col=rainbow(5))
 plot(spdf, add=T, pch=16, col=rainbow(5)[ spdf$ind ])

enter image description here

The clue is building the SpatialLines object later, once you have a list of Lines objects. The ID MUST be unique, otherwise all your Lines objects will have the same ID, and SpatialLines will through an error.

I prepared this example code to illustrate:

 library(sp)
 library(raster) # need a raster to generate fake data
 library(dismo)  # I'm using the "randomPoints" function from dismo
 
 # first we need a canvas
 # we can start with an arbitrary extent
 ext <- extent(-20,10,-10,0)
 r <- raster(ext) # this is our raster object
 r[] <- 1 # let's fill it up with 1's

 indiv <- LETTERS[1:5] # let's say we have 5 individuals with data
 df <- data.frame()
 # we are generating 10 random points per "individual"
 for (i in 1:5)
      df <- rbind(df,randomPoints(r, 10))
 # you will get a warning about the projection, ignore that.

 # with this we can generate a SpatialPointsDataFrame
 spdf <- SpatialPointsDataFrame(
              coords=as.matrix(df), 
              data=data.frame(ind=sort(rep(indiv,10))))

 # now we loop for each individual 
 # and store "Lines" objects in a list
 trajectories <- list()
 for (i in 1:length(indiv))
         trajectories[[i]] <- Lines(list(Line(subset(spdf, ind == indiv[i]))), 
                                    ID=paste(i))
 # pay close attention on how the Lines structure must be structured:
 # Lines(list(Line(spdf)), ID="unique string")

 # then we simply transform our trajectories list to SpatialLines
 splo <- SpatialLines(trajectories)

You can the visualize the data like this:

 image(r)
 plot(splo, add=T, col=rainbow(5))
 plot(spdf, add=T, pch=16, col=rainbow(5)[ spdf$ind ])

enter image description here

EDIT: fixed typos and better explanation.
Source Link
ssanch
  • 341
  • 2
  • 4
Loading
Source Link
ssanch
  • 341
  • 2
  • 4
Loading