Tweeted twitter.com/StackGIS/status/895431828001239041
deleted 37 characters in body; edited tags; edited title
Source Link
PolyGeo
  • 65.4k
  • 29
  • 114
  • 345

QGIS - Iterative Interpolation w/ Built-In Python Console Not Changing Columns in PyQGIS?

I am trying to iteratively interpolate a shapefile using the QGIS IDW interpolator. What I need to do is take a point shapefile with time series data in the columns associated with each point, interpolate that column of data to raster, then move to the next column, creating a new raster for each column.

The process I've generally been following is outlined here: How to compute an interpolation raster from the python console in QGIS?

I've modified a few things and have been working on a test case (since the input data hasn't been provided yet - format should be similar except ~300 iterations), but I can't get the interpolator to move past the first, 0-indexed, column.

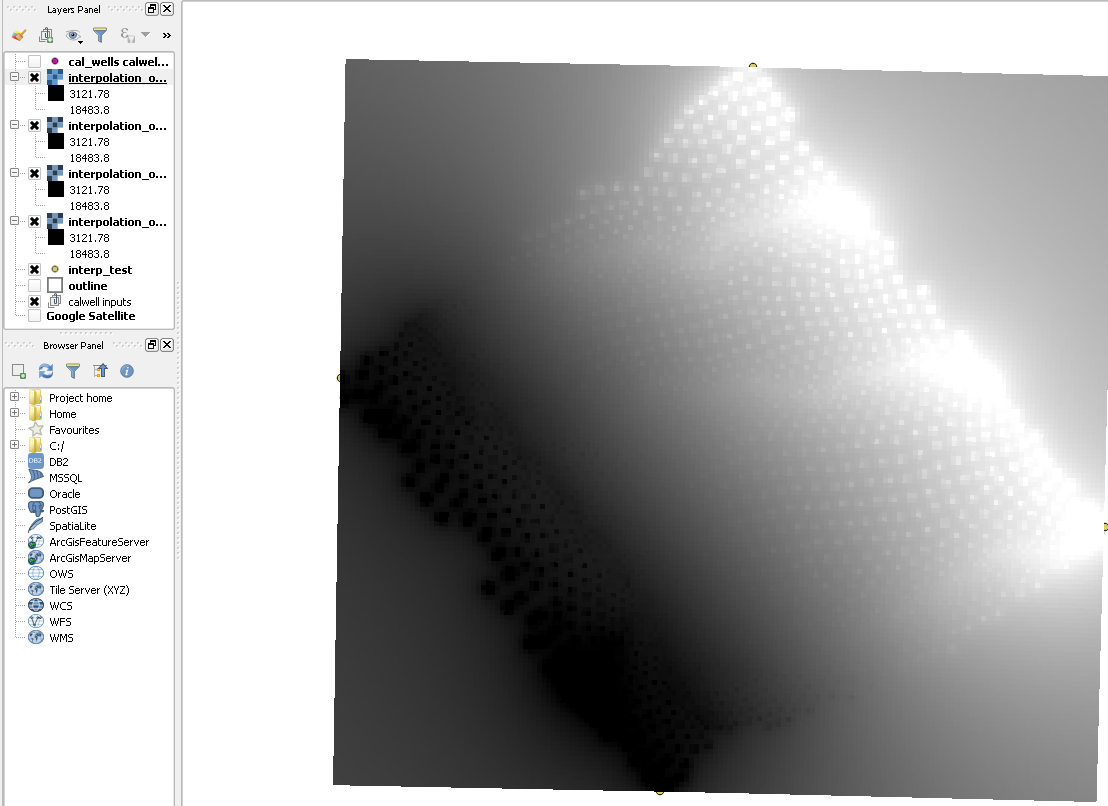
Code runs without error, outputs the 4 test raster interpolation .asc files, and adds them to the QGIS layers panel, but they are all the same. You can see in the layers panel snippet below that the raster cell bounds are all the same and visually if I toggle the layers on/off, they are all the same.

Code below (only change is that I modified actual folder paths to dummy variables):

import qgis.core
import qgis.analysis
import os


pathToFile = r"input_folder\interp_test.shp"

interp_layer = QgsVectorLayer(pathToFile, 'interp_test','ogr')

#not used yet
field_names = [field.name() for field in interp_layer.pendingFields()]

#test first 4 columns
for i in np.arange(0, 4):
    layer_data = qgis.analysis.QgsInterpolator.LayerData()
    layer_data.vectorLayer = interp_layer
    layer_data.zCoordInterpolation=False
    
    #this line should change the interpolation attribute/column, but it doesn't
    layer_data.InterpolationAttribute = i
    layer_data.mInputType = 1 #points
    
    #pick interpolator engine
    idw_interpolator = qgis.analysis.QgsIDWInterpolator([layer_data])
    
    export_path =r"output_folder\rasterout_{}.asc".format(i)
    rect = interp_layer.extent()
    res = 500
    ncol = int( ( rect.xMaximum() - rect.xMinimum() ) / res )
    nrows = int( (rect.yMaximum() - rect.yMinimum() ) / res)

    output = qgis.analysis.QgsGridFileWriter(idw_interpolator,export_path,rect,ncol, nrows,res,res)
    output.writeFile(True)  
    iface.addRasterLayer(export_path, "interpolation_output_{}.asc".format(i))

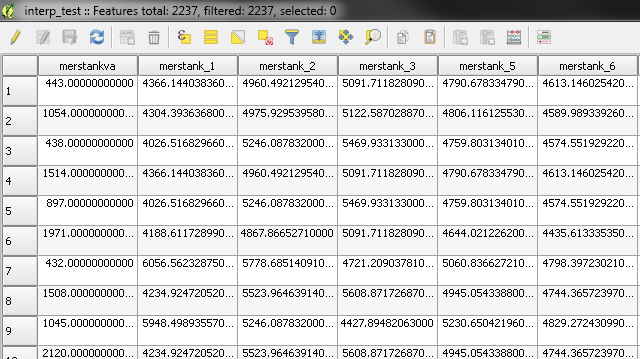
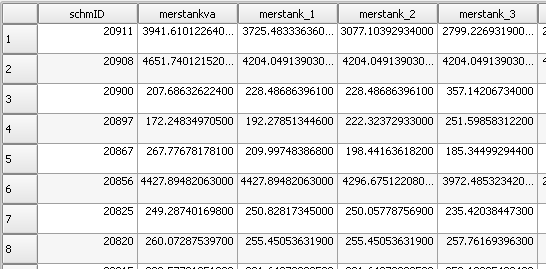
Input test attribute table: Input attribute table w/data to be interpolated

Output to QGIS console: Output interpolated raster, duplicated 4x

Any help would be much appreciated. RunningRunning 64-bit QGIS 2.18.3 on windows, using the built-in python console.

QGIS - Iterative Interpolation w/ Built-In Python Console Not Changing Columns

I am trying to iteratively interpolate a shapefile using the QGIS IDW interpolator. What I need to do is take a point shapefile with time series data in the columns associated with each point, interpolate that column of data to raster, then move to the next column, creating a new raster for each column.

The process I've generally been following is outlined here: How to compute an interpolation raster from the python console in QGIS?

I've modified a few things and have been working on a test case (since the input data hasn't been provided yet - format should be similar except ~300 iterations), but I can't get the interpolator to move past the first, 0-indexed, column.

Code runs without error, outputs the 4 test raster interpolation .asc files, and adds them to the QGIS layers panel, but they are all the same. You can see in the layers panel snippet below that the raster cell bounds are all the same and visually if I toggle the layers on/off, they are all the same.

Code below (only change is that I modified actual folder paths to dummy variables):

import qgis.core
import qgis.analysis
import os


pathToFile = r"input_folder\interp_test.shp"

interp_layer = QgsVectorLayer(pathToFile, 'interp_test','ogr')

#not used yet
field_names = [field.name() for field in interp_layer.pendingFields()]

#test first 4 columns
for i in np.arange(0, 4):
    layer_data = qgis.analysis.QgsInterpolator.LayerData()
    layer_data.vectorLayer = interp_layer
    layer_data.zCoordInterpolation=False
    
    #this line should change the interpolation attribute/column, but it doesn't
    layer_data.InterpolationAttribute = i
    layer_data.mInputType = 1 #points
    
    #pick interpolator engine
    idw_interpolator = qgis.analysis.QgsIDWInterpolator([layer_data])
    
    export_path =r"output_folder\rasterout_{}.asc".format(i)
    rect = interp_layer.extent()
    res = 500
    ncol = int( ( rect.xMaximum() - rect.xMinimum() ) / res )
    nrows = int( (rect.yMaximum() - rect.yMinimum() ) / res)

    output = qgis.analysis.QgsGridFileWriter(idw_interpolator,export_path,rect,ncol, nrows,res,res)
    output.writeFile(True)  
    iface.addRasterLayer(export_path, "interpolation_output_{}.asc".format(i))

Input test attribute table: Input attribute table w/data to be interpolated

Output to QGIS console: Output interpolated raster, duplicated 4x

Any help would be much appreciated. Running 64-bit QGIS 2.18.3 on windows, using the built-in python console.
Iterative Interpolation w/ Built-In Python Console Not Changing Columns in PyQGIS?

I am trying to iteratively interpolate a shapefile using the QGIS IDW interpolator. What I need to do is take a point shapefile with time series data in the columns associated with each point, interpolate that column of data to raster, then move to the next column, creating a new raster for each column.

The process I've generally been following is outlined here: How to compute an interpolation raster from the python console in QGIS?

I've modified a few things and have been working on a test case (since the input data hasn't been provided yet - format should be similar except ~300 iterations), but I can't get the interpolator to move past the first, 0-indexed, column.

Code runs without error, outputs the 4 test raster interpolation .asc files, and adds them to the QGIS layers panel, but they are all the same. You can see in the layers panel snippet below that the raster cell bounds are all the same and visually if I toggle the layers on/off, they are all the same.

Code below (only change is that I modified actual folder paths to dummy variables):

import qgis.core
import qgis.analysis
import os


pathToFile = r"input_folder\interp_test.shp"

interp_layer = QgsVectorLayer(pathToFile, 'interp_test','ogr')

#not used yet
field_names = [field.name() for field in interp_layer.pendingFields()]

#test first 4 columns
for i in np.arange(0, 4):
    layer_data = qgis.analysis.QgsInterpolator.LayerData()
    layer_data.vectorLayer = interp_layer
    layer_data.zCoordInterpolation=False
    
    #this line should change the interpolation attribute/column, but it doesn't
    layer_data.InterpolationAttribute = i
    layer_data.mInputType = 1 #points
    
    #pick interpolator engine
    idw_interpolator = qgis.analysis.QgsIDWInterpolator([layer_data])
    
    export_path =r"output_folder\rasterout_{}.asc".format(i)
    rect = interp_layer.extent()
    res = 500
    ncol = int( ( rect.xMaximum() - rect.xMinimum() ) / res )
    nrows = int( (rect.yMaximum() - rect.yMinimum() ) / res)

    output = qgis.analysis.QgsGridFileWriter(idw_interpolator,export_path,rect,ncol, nrows,res,res)
    output.writeFile(True)  
    iface.addRasterLayer(export_path, "interpolation_output_{}.asc".format(i))

Input test attribute table: Input attribute table w/data to be interpolated

Output to QGIS console: Output interpolated raster, duplicated 4x

Running 64-bit QGIS 2.18.3 on windows, using the built-in python console.
added 49 characters in body
Source Link

I am trying to iteratively interpolate a shapefile using the QGIS IDW interpolator. What I need to do is take a point shapefile with time series data in the columns associated with each point, interpolate that column of data to raster, then move to the next column, creating a new raster for each column.

The process I've generally been following is outlined here: How to compute an interpolation raster from the python console in QGIS?

I've modified a few things and have been working on a test case (since the input data hasn't been provided yet - format should be similar except ~300 iterations), but I can't get the interpolator to move past the first, 0-indexed, column.

Code runs without error, outputs the 4 test raster interpolation .asc files, and adds them to the QGIS layers panel, but they are all the same. You can see in the layers panel snippet below that the raster cell bounds are all the same and visually if I toggle the layers on/off, they are all the same.

Code below (only change is that I modified actual folder paths to dummy variables):

import qgis.core
import qgis.analysis
import os


pathToFile = r"input_folder\interp_test.shp"

interp_layer = QgsVectorLayer(pathToFile, 'interp_test','ogr')

#not used yet
field_names = [field.name() for field in interp_layer.pendingFields()]

#test first 4 columns
for i in np.arange(0, 4):
    layer_data = qgis.analysis.QgsInterpolator.LayerData()
    layer_data.vectorLayer = interp_layer
    layer_data.zCoordInterpolation=False
    
    #this line should change the interpolation attribute/column, but it doesn't
    layer_data.InterpolationAttribute = i
    layer_data.mInputType = 1 #points
    
    #pick interpolator engine
    idw_interpolator = qgis.analysis.QgsIDWInterpolator([layer_data])
    
    export_path =r"output_folder\rasterout_{}.asc".format(i)
    rect = interp_layer.extent()
    res = 500
    ncol = int( ( rect.xMaximum() - rect.xMinimum() ) / res )
    nrows = int( (rect.yMaximum() - rect.yMinimum() ) / res)

    output = qgis.analysis.QgsGridFileWriter(idw_interpolator,export_path,rect,ncol, nrows,res,res)
    output.writeFile(True)  
    iface.addRasterLayer(export_path, "interpolation_output_{}.asc".format(i))

Input test attribute table: Input attribute table w/data to be interpolated

Output to QGIS console: Output interpolated raster, duplicated 4x

Any help would be much appreciated. Running 64-bit QGIS 2.18.3 on windows, using the built-in python console.

I am trying to iteratively interpolate a shapefile using the QGIS IDW interpolator. What I need to do is take a point shapefile with time series data in the columns associated with each point, interpolate that column of data, then move to the next column.

The process I've generally been following is outlined here: How to compute an interpolation raster from the python console in QGIS?

I've modified a few things and have been working on a test case (since the input data hasn't been provided yet - format should be similar except ~300 iterations), but I can't get the interpolator to move past the first, 0-indexed, column.

Code runs without error, outputs the 4 test raster interpolation .asc files, and adds them to the QGIS layers panel, but they are all the same. You can see in the layers panel snippet below that the raster cell bounds are all the same and visually if I toggle the layers on/off, they are all the same.

Code below (only change is that I modified actual folder paths to dummy variables):

import qgis.core
import qgis.analysis
import os


pathToFile = r"input_folder\interp_test.shp"

interp_layer = QgsVectorLayer(pathToFile, 'interp_test','ogr')

#not used yet
field_names = [field.name() for field in interp_layer.pendingFields()]

#test first 4 columns
for i in np.arange(0, 4):
    layer_data = qgis.analysis.QgsInterpolator.LayerData()
    layer_data.vectorLayer = interp_layer
    layer_data.zCoordInterpolation=False
    
    #this line should change the interpolation attribute/column, but it doesn't
    layer_data.InterpolationAttribute = i
    layer_data.mInputType = 1 #points
    
    #pick interpolator engine
    idw_interpolator = qgis.analysis.QgsIDWInterpolator([layer_data])
    
    export_path =r"output_folder\rasterout_{}.asc".format(i)
    rect = interp_layer.extent()
    res = 500
    ncol = int( ( rect.xMaximum() - rect.xMinimum() ) / res )
    nrows = int( (rect.yMaximum() - rect.yMinimum() ) / res)

    output = qgis.analysis.QgsGridFileWriter(idw_interpolator,export_path,rect,ncol, nrows,res,res)
    output.writeFile(True)  
    iface.addRasterLayer(export_path, "interpolation_output_{}.asc".format(i))

Input test attribute table: Input attribute table w/data to be interpolated

Output to QGIS console: Output interpolated raster, duplicated 4x

Any help would be much appreciated. Running 64-bit QGIS 2.18.3 on windows, using the built-in python console.

I am trying to iteratively interpolate a shapefile using the QGIS IDW interpolator. What I need to do is take a point shapefile with time series data in the columns associated with each point, interpolate that column of data to raster, then move to the next column, creating a new raster for each column.

The process I've generally been following is outlined here: How to compute an interpolation raster from the python console in QGIS?

I've modified a few things and have been working on a test case (since the input data hasn't been provided yet - format should be similar except ~300 iterations), but I can't get the interpolator to move past the first, 0-indexed, column.

Code runs without error, outputs the 4 test raster interpolation .asc files, and adds them to the QGIS layers panel, but they are all the same. You can see in the layers panel snippet below that the raster cell bounds are all the same and visually if I toggle the layers on/off, they are all the same.

Code below (only change is that I modified actual folder paths to dummy variables):

import qgis.core
import qgis.analysis
import os


pathToFile = r"input_folder\interp_test.shp"

interp_layer = QgsVectorLayer(pathToFile, 'interp_test','ogr')

#not used yet
field_names = [field.name() for field in interp_layer.pendingFields()]

#test first 4 columns
for i in np.arange(0, 4):
    layer_data = qgis.analysis.QgsInterpolator.LayerData()
    layer_data.vectorLayer = interp_layer
    layer_data.zCoordInterpolation=False
    
    #this line should change the interpolation attribute/column, but it doesn't
    layer_data.InterpolationAttribute = i
    layer_data.mInputType = 1 #points
    
    #pick interpolator engine
    idw_interpolator = qgis.analysis.QgsIDWInterpolator([layer_data])
    
    export_path =r"output_folder\rasterout_{}.asc".format(i)
    rect = interp_layer.extent()
    res = 500
    ncol = int( ( rect.xMaximum() - rect.xMinimum() ) / res )
    nrows = int( (rect.yMaximum() - rect.yMinimum() ) / res)

    output = qgis.analysis.QgsGridFileWriter(idw_interpolator,export_path,rect,ncol, nrows,res,res)
    output.writeFile(True)  
    iface.addRasterLayer(export_path, "interpolation_output_{}.asc".format(i))

Input test attribute table: Input attribute table w/data to be interpolated

Output to QGIS console: Output interpolated raster, duplicated 4x

Any help would be much appreciated. Running 64-bit QGIS 2.18.3 on windows, using the built-in python console.

added 7 characters in body
Source Link

I am trying to iteratively interpolate a shapefile using the QGIS IDW interpolator. What I need to do is take a point shapefile with time series data in the columns associated with each point, interpolate that column of data, then move to the next column.

The process I've generally been following is outlined here: How to compute an interpolation raster from the python console in QGIS?

I've modified a few things and have been working on a test case (since the input data hasn't been provided yet - format should be similar except ~300 iterations), but I can't get the interpolator to move past the first, 0-indexed, column.

Code runs without error, outputs the 4 test raster interpolation .asc files, and adds them to the QGIS layers panel, but they are all the same. You can see in the layers panel snippet below that the raster cell bounds are all the same and visually if I toggle the layers on/off, they are all the same.

Code below (only change is that I modified actual folder paths to dummy variables):

import qgis.core
import qgis.analysis
import os


pathToFile = r"input_folder\interp_test.shp"

interp_layer = QgsVectorLayer(pathToFile, 'interp_test','ogr')

#not used yet
field_names = [field.name() for field in interp_layer.pendingFields()]

#test first 4 columns
for i in np.arange(0, 4):
    layer_data = qgis.analysis.QgsInterpolator.LayerData()
    layer_data.vectorLayer = interp_layer
    layer_data.zCoordInterpolation=False
    
    #this line should change the interpolation attribute/column, but it doesn't
    layer_data.InterpolationAttribute = i
    layer_data.mInputType = 1 #points
    
    #pick interpolator engine
    idw_interpolator = qgis.analysis.QgsIDWInterpolator([layer_data])
    
    export_path =r"output_folder\rasterout_{}.asc".format(i)
    rect = interp_layer.extent()
    res = 500
    ncol = int( ( rect.xMaximum() - rect.xMinimum() ) / res )
    nrows = int( (rect.yMaximum() - rect.yMinimum() ) / res)

    output = qgis.analysis.QgsGridFileWriter(idw_interpolator,export_path,rect,ncol, nrows,res,res)
    output.writeFile(True)  
    iface.addRasterLayer(export_path, "interpolation_output_{}.asc".format(i))

Input test attribute table: Attribute table of interpolation inputInput attribute table w/data to be interpolated

Output to QGIS console: Output interpolated raster, duplicated 4x

Any help would be much appreciated. Running 64-bit QGIS 2.18.3 on windows, using the built-in python console.

I am trying to iteratively interpolate a shapefile using the QGIS IDW interpolator. What I need to do is take a point shapefile with time series data in the columns associated with each point, interpolate that column of data, then move to the next column.

The process I've generally been following is outlined here: How to compute an interpolation raster from the python console in QGIS?

I've modified a few things and have been working on a test case (since the input data hasn't been provided yet - format should be similar except ~300 iterations), but I can't get the interpolator to move past the first, 0-indexed, column.

Code runs without error, outputs the 4 test raster interpolation .asc files, and adds them to the QGIS layers panel, but they are all the same. You can see in the layers panel snippet below that the raster cell bounds are all the same and visually if I toggle the layers on/off, they are all the same.

Code below (only change is that I modified actual folder paths to dummy variables):

import qgis.core
import qgis.analysis
import os


pathToFile = r"input_folder\interp_test.shp"

interp_layer = QgsVectorLayer(pathToFile, 'interp_test','ogr')

#not used yet
field_names = [field.name() for field in interp_layer.pendingFields()]

#test first 4 columns
for i in np.arange(0, 4):
    layer_data = qgis.analysis.QgsInterpolator.LayerData()
    layer_data.vectorLayer = interp_layer
    layer_data.zCoordInterpolation=False
    
    #this line should change the interpolation attribute/column, but it doesn't
    layer_data.InterpolationAttribute = i
    layer_data.mInputType = 1 #points
    
    #pick interpolator engine
    idw_interpolator = qgis.analysis.QgsIDWInterpolator([layer_data])
    
    export_path =r"output_folder\rasterout_{}.asc".format(i)
    rect = interp_layer.extent()
    res = 500
    ncol = int( ( rect.xMaximum() - rect.xMinimum() ) / res )
    nrows = int( (rect.yMaximum() - rect.yMinimum() ) / res)

    output = qgis.analysis.QgsGridFileWriter(idw_interpolator,export_path,rect,ncol, nrows,res,res)
    output.writeFile(True)  
    iface.addRasterLayer(export_path, "interpolation_output_{}.asc".format(i))

Input test attribute table: Attribute table of interpolation input

Output to QGIS console: Output interpolated raster, duplicated 4x

Any help would be much appreciated. Running 64-bit QGIS 2.18.3 on windows, using the built-in python console.

I am trying to iteratively interpolate a shapefile using the QGIS IDW interpolator. What I need to do is take a point shapefile with time series data in the columns associated with each point, interpolate that column of data, then move to the next column.

The process I've generally been following is outlined here: How to compute an interpolation raster from the python console in QGIS?

I've modified a few things and have been working on a test case (since the input data hasn't been provided yet - format should be similar except ~300 iterations), but I can't get the interpolator to move past the first, 0-indexed, column.

Code runs without error, outputs the 4 test raster interpolation .asc files, and adds them to the QGIS layers panel, but they are all the same. You can see in the layers panel snippet below that the raster cell bounds are all the same and visually if I toggle the layers on/off, they are all the same.

Code below (only change is that I modified actual folder paths to dummy variables):

import qgis.core
import qgis.analysis
import os


pathToFile = r"input_folder\interp_test.shp"

interp_layer = QgsVectorLayer(pathToFile, 'interp_test','ogr')

#not used yet
field_names = [field.name() for field in interp_layer.pendingFields()]

#test first 4 columns
for i in np.arange(0, 4):
    layer_data = qgis.analysis.QgsInterpolator.LayerData()
    layer_data.vectorLayer = interp_layer
    layer_data.zCoordInterpolation=False
    
    #this line should change the interpolation attribute/column, but it doesn't
    layer_data.InterpolationAttribute = i
    layer_data.mInputType = 1 #points
    
    #pick interpolator engine
    idw_interpolator = qgis.analysis.QgsIDWInterpolator([layer_data])
    
    export_path =r"output_folder\rasterout_{}.asc".format(i)
    rect = interp_layer.extent()
    res = 500
    ncol = int( ( rect.xMaximum() - rect.xMinimum() ) / res )
    nrows = int( (rect.yMaximum() - rect.yMinimum() ) / res)

    output = qgis.analysis.QgsGridFileWriter(idw_interpolator,export_path,rect,ncol, nrows,res,res)
    output.writeFile(True)  
    iface.addRasterLayer(export_path, "interpolation_output_{}.asc".format(i))

Input test attribute table: Input attribute table w/data to be interpolated

Output to QGIS console: Output interpolated raster, duplicated 4x

Any help would be much appreciated. Running 64-bit QGIS 2.18.3 on windows, using the built-in python console.

Source Link
Loading