deleted 37 characters in body
Source Link
PolyGeo
  • 65.4k
  • 29
  • 114
  • 345

Thank you very much for your help

Possible solution: (takes a long time to compute)

library(raster)
library(sp)

# create elevation raster
e <- as(extent(-1942755,-1847241,2524840,2624901), "SpatialPolygons") 
proj4string(e) <- "+proj=aea +lat_1=29.5 +lat_2=45.5 +lat_0=23 +lon_0=-96 +x_0=0 +y_0=0 +datum=NAD83 +units=m +no_defs +ellps=GRS80 +towgs84=0,0,0"

r <- raster(e, res=1000)
r[] <- runif(ncell(r),500,2500)

# plot raster
x11()
plot(r)

# creat coordinates
xy <- data.frame(x= c(-1859255, -1876255), y=c(2586401, 2552401))

# add coordinates to plot
points(-1859255, 2586401, col="red", cex=3, pch= 19)
points(-1876255, 2552401, col="red", cex=3, pch= 19)

#creat spatial line
l <- SpatialLines(list(Lines(list(Line(xy)),ID="1"))) 

#add spatial line to plot
plot(l, add=TRUE, lwd=3, col="Blue")

#create points along line
library(rgeos)
library(sp)
numOfPoints  <-  gLength(l)*10 #segments of 10cm if l in meters
points<-spsample(l, n = numOfPoints, type = "regular")

#add points to plot
plot(points, add=TRUE)


#get elevation for each points
points.df<-as.data.frame(points)
points.df$elevation<-raster::extract(r, points.df)

#comput distance between each points

head(points.df)
output<-data.frame(length=1:length(points.df$x))
i.2<-(length(points.df$x)-1) #last point has no further point for a distance
for(i in 1:i.2){
 
x1<-points.df[i,"x"]
x2<-points.df[i+1,"x"]
y1<-points.df[i,"y"]
y2<-points.df[i+1,"y"]
z1<-points.df[i,"elevation"]
z2<-points.df[i+1,"elevation"]


Distance<-((x1-x2)^2+(y1-y2)^2+(z1-z2)^2)^0.5

output[i,]<-Distance
}
output[length(points.df$x),]<-0 #last point has no further point for a distance

sum(output) # Length between A and B

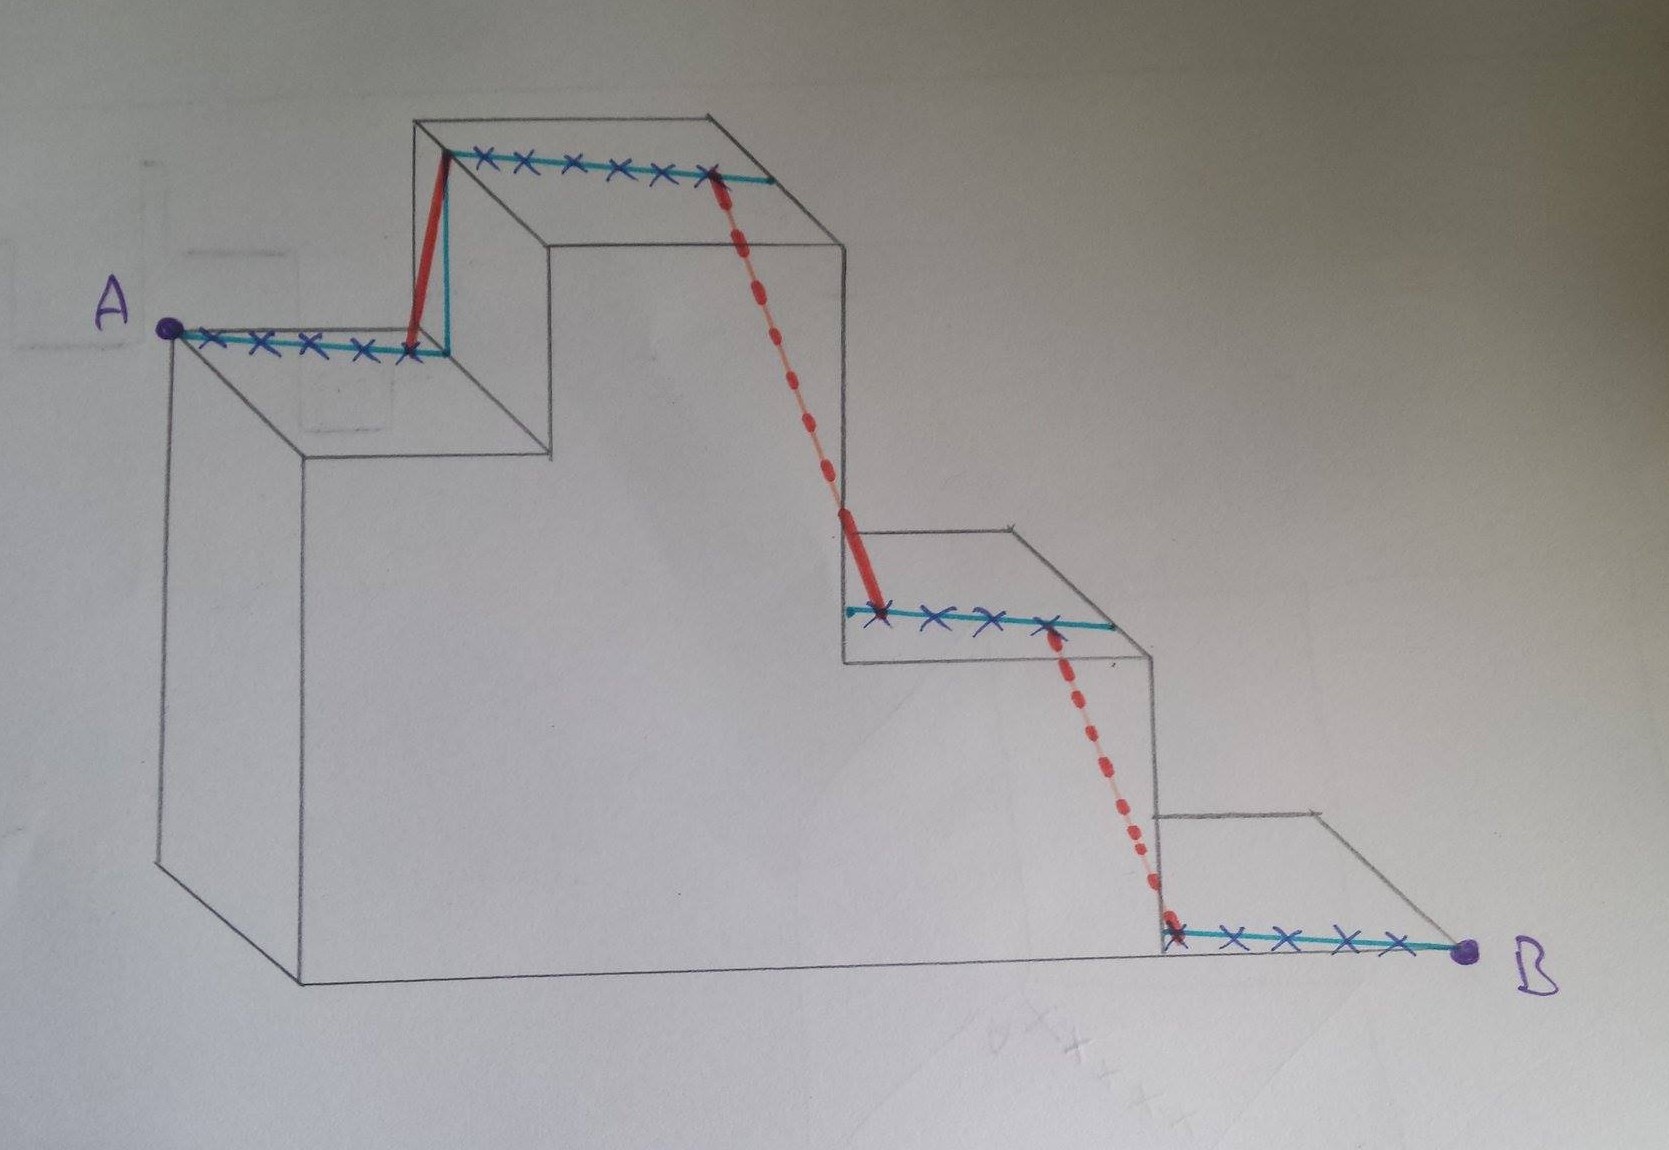
This method allows for the calculation of the distance between two coordinates (A,B) considering an elevation raster. The "line" is fragmented into segments delimited by sub-coordinates (points) plotted at an equal distance on the line. The line is thus linking points A and B by following the raster layer surface. When two sub-coordinates are in the same cell, the distance is the horizontal distance (blue). When the two coordinates are in differents cells, the distance is the hypotenuse length (red). enter image description here
plot

Thank you very much for your help

Possible solution: (takes a long time to compute)

library(raster)
library(sp)

# create elevation raster
e <- as(extent(-1942755,-1847241,2524840,2624901), "SpatialPolygons") 
proj4string(e) <- "+proj=aea +lat_1=29.5 +lat_2=45.5 +lat_0=23 +lon_0=-96 +x_0=0 +y_0=0 +datum=NAD83 +units=m +no_defs +ellps=GRS80 +towgs84=0,0,0"

r <- raster(e, res=1000)
r[] <- runif(ncell(r),500,2500)

# plot raster
x11()
plot(r)

# creat coordinates
xy <- data.frame(x= c(-1859255, -1876255), y=c(2586401, 2552401))

# add coordinates to plot
points(-1859255, 2586401, col="red", cex=3, pch= 19)
points(-1876255, 2552401, col="red", cex=3, pch= 19)

#creat spatial line
l <- SpatialLines(list(Lines(list(Line(xy)),ID="1"))) 

#add spatial line to plot
plot(l, add=TRUE, lwd=3, col="Blue")

#create points along line
library(rgeos)
library(sp)
numOfPoints  <-  gLength(l)*10 #segments of 10cm if l in meters
points<-spsample(l, n = numOfPoints, type = "regular")

#add points to plot
plot(points, add=TRUE)


#get elevation for each points
points.df<-as.data.frame(points)
points.df$elevation<-raster::extract(r, points.df)

#comput distance between each points

head(points.df)
output<-data.frame(length=1:length(points.df$x))
i.2<-(length(points.df$x)-1) #last point has no further point for a distance
for(i in 1:i.2){
 
x1<-points.df[i,"x"]
x2<-points.df[i+1,"x"]
y1<-points.df[i,"y"]
y2<-points.df[i+1,"y"]
z1<-points.df[i,"elevation"]
z2<-points.df[i+1,"elevation"]


Distance<-((x1-x2)^2+(y1-y2)^2+(z1-z2)^2)^0.5

output[i,]<-Distance
}
output[length(points.df$x),]<-0 #last point has no further point for a distance

sum(output) # Length between A and B

This method allows for the calculation of the distance between two coordinates (A,B) considering an elevation raster. The "line" is fragmented into segments delimited by sub-coordinates (points) plotted at an equal distance on the line. The line is thus linking points A and B by following the raster layer surface. When two sub-coordinates are in the same cell, the distance is the horizontal distance (blue). When the two coordinates are in differents cells, the distance is the hypotenuse length (red). enter image description here

plot

Possible solution: (takes a long time to compute)

library(raster)
library(sp)

# create elevation raster
e <- as(extent(-1942755,-1847241,2524840,2624901), "SpatialPolygons") 
proj4string(e) <- "+proj=aea +lat_1=29.5 +lat_2=45.5 +lat_0=23 +lon_0=-96 +x_0=0 +y_0=0 +datum=NAD83 +units=m +no_defs +ellps=GRS80 +towgs84=0,0,0"

r <- raster(e, res=1000)
r[] <- runif(ncell(r),500,2500)

# plot raster
x11()
plot(r)

# creat coordinates
xy <- data.frame(x= c(-1859255, -1876255), y=c(2586401, 2552401))

# add coordinates to plot
points(-1859255, 2586401, col="red", cex=3, pch= 19)
points(-1876255, 2552401, col="red", cex=3, pch= 19)

#creat spatial line
l <- SpatialLines(list(Lines(list(Line(xy)),ID="1"))) 

#add spatial line to plot
plot(l, add=TRUE, lwd=3, col="Blue")

#create points along line
library(rgeos)
library(sp)
numOfPoints  <-  gLength(l)*10 #segments of 10cm if l in meters
points<-spsample(l, n = numOfPoints, type = "regular")

#add points to plot
plot(points, add=TRUE)


#get elevation for each points
points.df<-as.data.frame(points)
points.df$elevation<-raster::extract(r, points.df)

#comput distance between each points

head(points.df)
output<-data.frame(length=1:length(points.df$x))
i.2<-(length(points.df$x)-1) #last point has no further point for a distance
for(i in 1:i.2){
 
x1<-points.df[i,"x"]
x2<-points.df[i+1,"x"]
y1<-points.df[i,"y"]
y2<-points.df[i+1,"y"]
z1<-points.df[i,"elevation"]
z2<-points.df[i+1,"elevation"]


Distance<-((x1-x2)^2+(y1-y2)^2+(z1-z2)^2)^0.5

output[i,]<-Distance
}
output[length(points.df$x),]<-0 #last point has no further point for a distance

sum(output) # Length between A and B

This method allows for the calculation of the distance between two coordinates (A,B) considering an elevation raster. The "line" is fragmented into segments delimited by sub-coordinates (points) plotted at an equal distance on the line. The line is thus linking points A and B by following the raster layer surface. When two sub-coordinates are in the same cell, the distance is the horizontal distance (blue). When the two coordinates are in differents cells, the distance is the hypotenuse length (red). enter image description here
plot

Post Undeleted by Luc
added 699 characters in body
Source Link
Luc
  • 91
  • 1
  • 6

Thank you very much Jeffrey Evans.for your help

Do you know if it is possible to get the length of the line that crosses over a cell? Sometimes the line crosses in the middle of a cell and sometimes inPossible solution: (takes a corner.

length of the line segment crossing a cell varieslong time to compute)

#Example with the code provided before by Jeffrey Evans 
library(raster)
library(sp)

# create elevation raster
e <- as(extent(-1942755,-1847241,2524840,2624901), "SpatialPolygons") 
proj4string(e) <- "+proj=aea +lat_1=29.5 +lat_2=45.5 +lat_0=23 +lon_0=-96 +x_0=0 +y_0=0 +datum=NAD83 +units=m +no_defs +ellps=GRS80 +towgs84=0,0,0"

r <- raster(e, res=1000)
r[] <- runif(ncell(r),500,2500)

# plot raster
x11()
plot(r)

# creat coordinates
xy <- data.frame(x= c(-1859255, -1876255), y=c(2586401, 2552401))

#get elevation of coordinates
elev <- raster::extract(r, SpatialPoints(xy))
#get distance between the two coordinates
d <- spDists( SpatialPoints(xy) )[2] 

# add coordinates to plot
points(-1859255, 2586401, col="red", cex=3, pch= 19)
points(-1876255, 2552401, col="red", cex=3, pch= 19)

#creat spatial line
l <- SpatialLines(list(Lines(list(Line(xy)),ID="1"))) 

#add spatial line to plot
plot(l, add=TRUE, lwd=3, col="Blue")

# extract#create elevationpoints along the line
elevlibrary(rgeos)
library(sp)
numOfPoints  <- unlist gLength(extractl)*10 #segments of 10cm if l in meters
points<-spsample(rl, l)n = numOfPoints, type = "regular")

#plot#add elevationpoints profileto plot
plot(elevpoints, type="o"add=TRUE)


#get #elevation !!!!!!for Hereeach points
points.df<-as.data.frame(points)
points.df$elevation<-raster::extract(r, Ipoints.df)

#comput woulddistance likebetween toeach knowpoints

head(points.df)
output<-data.frame(length=1:length(points.df$x))
i.2<-(length(points.df$x)-1) the#last lengthpoint ofhas eachno segementsfurther onpoint thefor horizontala axisdistance
for(i in 1:i.2){
 
x1<-points.df[i,"x"]
x2<-points.df[i+1,"x"]
y1<-points.df[i,"y"]
y2<-points.df[i+1,"y"]
z1<-points.df[i,"elevation"]
z2<-points.df[i+1,"elevation"]


Distance<-((x1-x2)^2+(y1-y2)^2+(z1-z2)^2)^0.5

output[i,]<-Distance
}
output[length(points.df$x),]<-0 #last point has no further point for a distance

sum(output) # Length between A and B

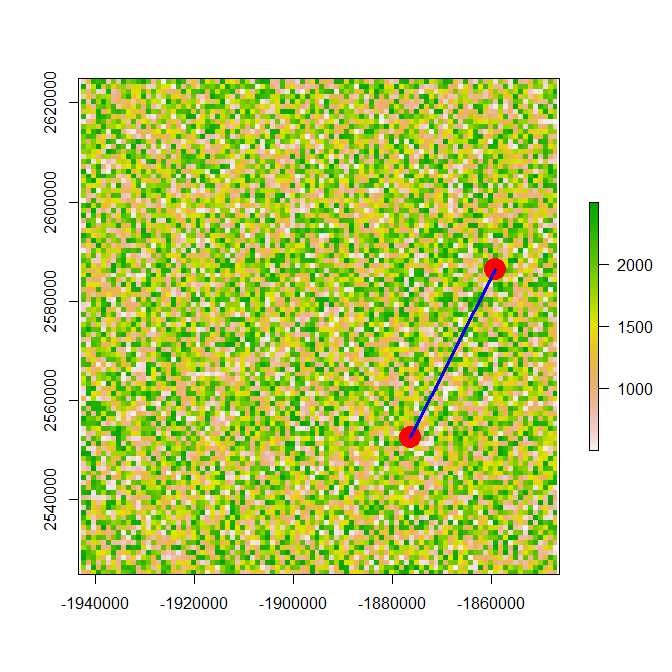
Elevation raster with 2 coordinates linked by a line Elevation profile (but we do not know the length of the segment on the horizontal axis This method allows for the calculation of the distance between two coordinates (A,B) considering an elevation raster. The "line" is fragmented into segments delimited by sub-coordinates (points) plotted at an equal distance on the line. The line is thus linking points A and B by following the raster layer surface. When two sub-coordinates are in the same cell, the distance is the horizontal distance (blue). When the two coordinates are in differents cells, the distance is the hypotenuse length (red). enter image description here
plot

Thank you very much Jeffrey Evans.

Do you know if it is possible to get the length of the line that crosses over a cell? Sometimes the line crosses in the middle of a cell and sometimes in a corner.

length of the line segment crossing a cell varies

#Example with the code provided before by Jeffrey Evans 
library(raster)
library(sp)

# create elevation raster
e <- as(extent(-1942755,-1847241,2524840,2624901), "SpatialPolygons") 
proj4string(e) <- "+proj=aea +lat_1=29.5 +lat_2=45.5 +lat_0=23 +lon_0=-96 +x_0=0 +y_0=0 +datum=NAD83 +units=m +no_defs +ellps=GRS80 +towgs84=0,0,0"

r <- raster(e, res=1000)
r[] <- runif(ncell(r),500,2500)

# plot raster
plot(r)

# creat coordinates
xy <- data.frame(x= c(-1859255, -1876255), y=c(2586401, 2552401))

#get elevation of coordinates
elev <- raster::extract(r, SpatialPoints(xy))
#get distance between the two coordinates
d <- spDists( SpatialPoints(xy) )[2] 

# add coordinates to plot
points(-1859255, 2586401, col="red", cex=3, pch= 19)
points(-1876255, 2552401, col="red", cex=3, pch= 19)

#creat spatial line
l <- SpatialLines(list(Lines(list(Line(xy)),ID="1"))) 

#add spatial line to plot
plot(l, add=TRUE, lwd=3, col="Blue")

# extract elevation along the line
elev <- unlist(extract(r, l))

#plot elevation profile
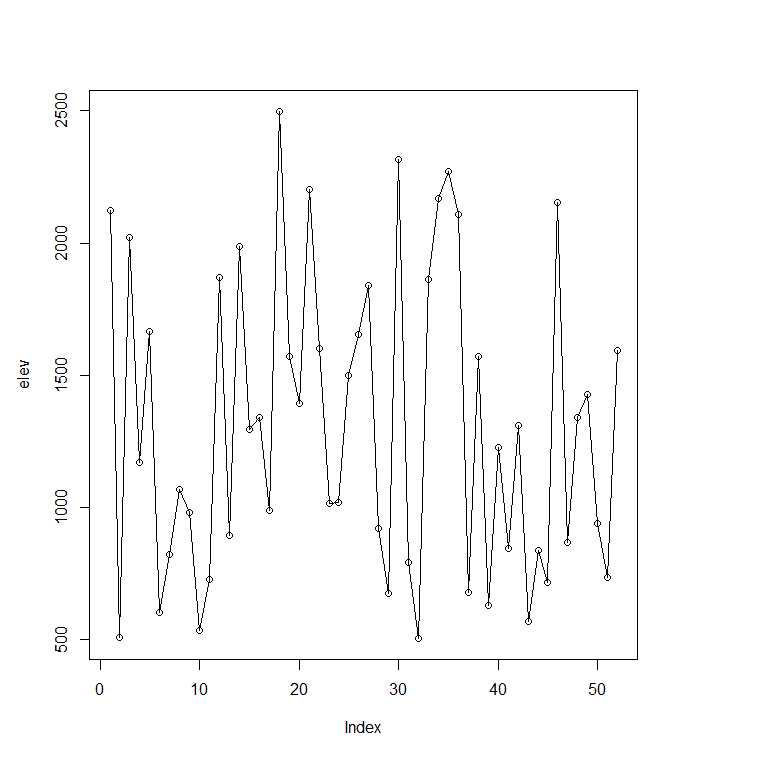
plot(elev, type="o") # !!!!!! Here, I would like to know the length of each segements on the horizontal axis.

Elevation raster with 2 coordinates linked by a line Elevation profile (but we do not know the length of the segment on the horizontal axis

Thank you very much for your help

Possible solution: (takes a long time to compute)

library(raster)
library(sp)

# create elevation raster
e <- as(extent(-1942755,-1847241,2524840,2624901), "SpatialPolygons") 
proj4string(e) <- "+proj=aea +lat_1=29.5 +lat_2=45.5 +lat_0=23 +lon_0=-96 +x_0=0 +y_0=0 +datum=NAD83 +units=m +no_defs +ellps=GRS80 +towgs84=0,0,0"

r <- raster(e, res=1000)
r[] <- runif(ncell(r),500,2500)

# plot raster
x11()
plot(r)

# creat coordinates
xy <- data.frame(x= c(-1859255, -1876255), y=c(2586401, 2552401))

# add coordinates to plot
points(-1859255, 2586401, col="red", cex=3, pch= 19)
points(-1876255, 2552401, col="red", cex=3, pch= 19)

#creat spatial line
l <- SpatialLines(list(Lines(list(Line(xy)),ID="1"))) 

#add spatial line to plot
plot(l, add=TRUE, lwd=3, col="Blue")

#create points along line
library(rgeos)
library(sp)
numOfPoints  <-  gLength(l)*10 #segments of 10cm if l in meters
points<-spsample(l, n = numOfPoints, type = "regular")

#add points to plot
plot(points, add=TRUE)


#get elevation for each points
points.df<-as.data.frame(points)
points.df$elevation<-raster::extract(r, points.df)

#comput distance between each points

head(points.df)
output<-data.frame(length=1:length(points.df$x))
i.2<-(length(points.df$x)-1) #last point has no further point for a distance
for(i in 1:i.2){
 
x1<-points.df[i,"x"]
x2<-points.df[i+1,"x"]
y1<-points.df[i,"y"]
y2<-points.df[i+1,"y"]
z1<-points.df[i,"elevation"]
z2<-points.df[i+1,"elevation"]


Distance<-((x1-x2)^2+(y1-y2)^2+(z1-z2)^2)^0.5

output[i,]<-Distance
}
output[length(points.df$x),]<-0 #last point has no further point for a distance

sum(output) # Length between A and B

This method allows for the calculation of the distance between two coordinates (A,B) considering an elevation raster. The "line" is fragmented into segments delimited by sub-coordinates (points) plotted at an equal distance on the line. The line is thus linking points A and B by following the raster layer surface. When two sub-coordinates are in the same cell, the distance is the horizontal distance (blue). When the two coordinates are in differents cells, the distance is the hypotenuse length (red). enter image description here
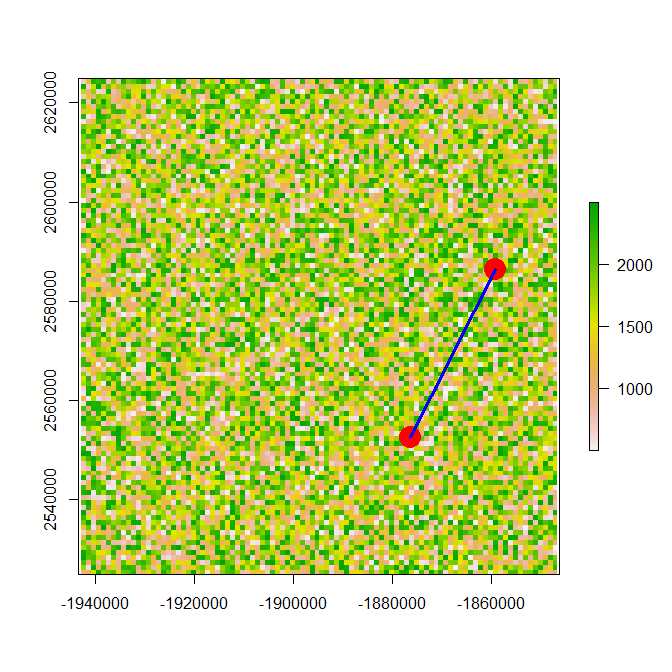
plot

Post Deleted From Review
code edit
Source Link
gisnside
  • 7.9k
  • 2
  • 32
  • 74

#Example with the code provided before by Jeffrey Evans library(raster) library(sp)

create elevation raster

e <- as(extent(-1942755,-1847241,2524840,2624901), "SpatialPolygons") proj4string(e) <- "+proj=aea +lat_1=29.5 +lat_2=45.5 +lat_0=23 +lon_0=-96 +x_0=0 +y_0=0 +datum=NAD83 +units=m +no_defs +ellps=GRS80 +towgs84=0,0,0"

r <- raster(e, res=1000) r[] <- runif(ncell(r),500,2500)

plot raster

plot(r)

creat coordinates

xy <- data.frame(x= c(-1859255, -1876255), y=c(2586401, 2552401))

#get elevation of coordinates elev <- raster::extract(r, SpatialPoints(xy)) #get distance between the two coordinates d <- spDists( SpatialPoints(xy) )2

add coordinates to plot

points(-1859255, 2586401, col="red", cex=3, pch= 19) points(-1876255, 2552401, col="red", cex=3, pch= 19)

#creat spatial line l <- SpatialLines(list(Lines(list(Line(xy)),ID="1")))

#add spatial line to plot plot(l, add=TRUE, lwd=3, col="Blue")

extract elevation along the line

elev <- unlist(extract(r, l))

#plot elevation profile plot(elev, type="o") # !!!!!! Here, I would like to know the length of each segements on the horizontal axis.

#Example with the code provided before by Jeffrey Evans 
library(raster)
library(sp)

# create elevation raster
e <- as(extent(-1942755,-1847241,2524840,2624901), "SpatialPolygons") 
proj4string(e) <- "+proj=aea +lat_1=29.5 +lat_2=45.5 +lat_0=23 +lon_0=-96 +x_0=0 +y_0=0 +datum=NAD83 +units=m +no_defs +ellps=GRS80 +towgs84=0,0,0"

r <- raster(e, res=1000)
r[] <- runif(ncell(r),500,2500)

# plot raster
plot(r)

# creat coordinates
xy <- data.frame(x= c(-1859255, -1876255), y=c(2586401, 2552401))

#get elevation of coordinates
elev <- raster::extract(r, SpatialPoints(xy))
#get distance between the two coordinates
d <- spDists( SpatialPoints(xy) )[2] 

# add coordinates to plot
points(-1859255, 2586401, col="red", cex=3, pch= 19)
points(-1876255, 2552401, col="red", cex=3, pch= 19)

#creat spatial line
l <- SpatialLines(list(Lines(list(Line(xy)),ID="1"))) 

#add spatial line to plot
plot(l, add=TRUE, lwd=3, col="Blue")

# extract elevation along the line
elev <- unlist(extract(r, l))

#plot elevation profile
plot(elev, type="o") # !!!!!! Here, I would like to know the length of each segements on the horizontal axis.
Source Link
Luc
  • 91
  • 1
  • 6
Loading