 |        Projection: Latitude-Longitude
 |
 |            N: 11:15:44.273502N    S: 10:55:46.447629N   Res: 0:00:02.76634 |
 |            E: 87:04:08.435069W    W: 87:23:22.390832W   Res: 0:00:02.80086 |
 |   Range of data:    min = -4783.09  max = -760.2788                        ||`
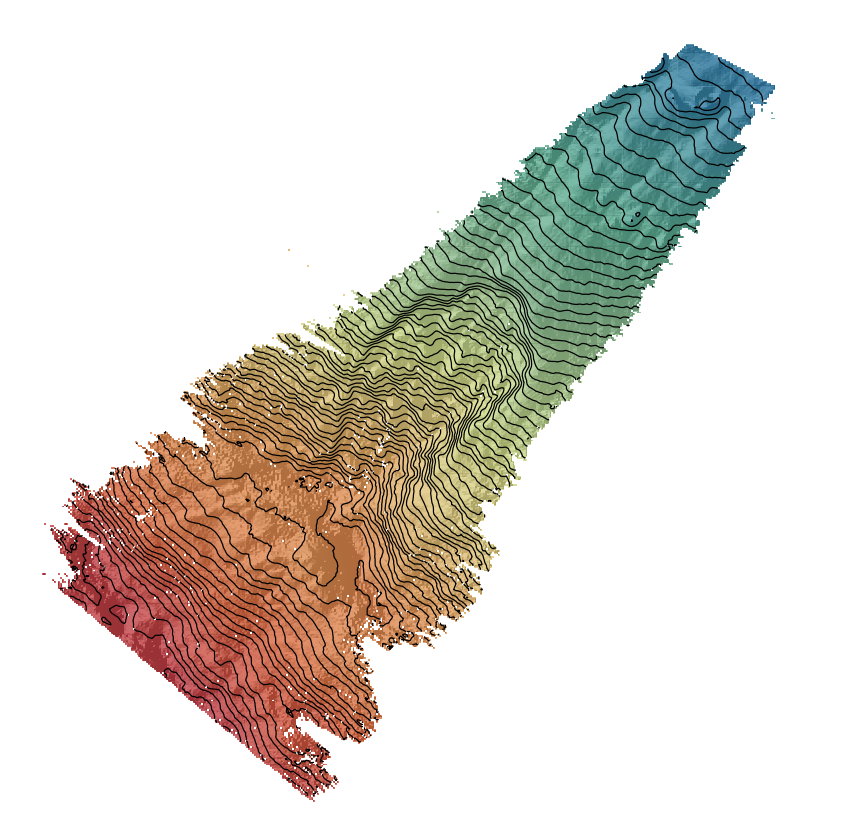
Load the DTM and set the region to the input data
r.import input=C:...\mb.grd output=mb g.region raster=mb
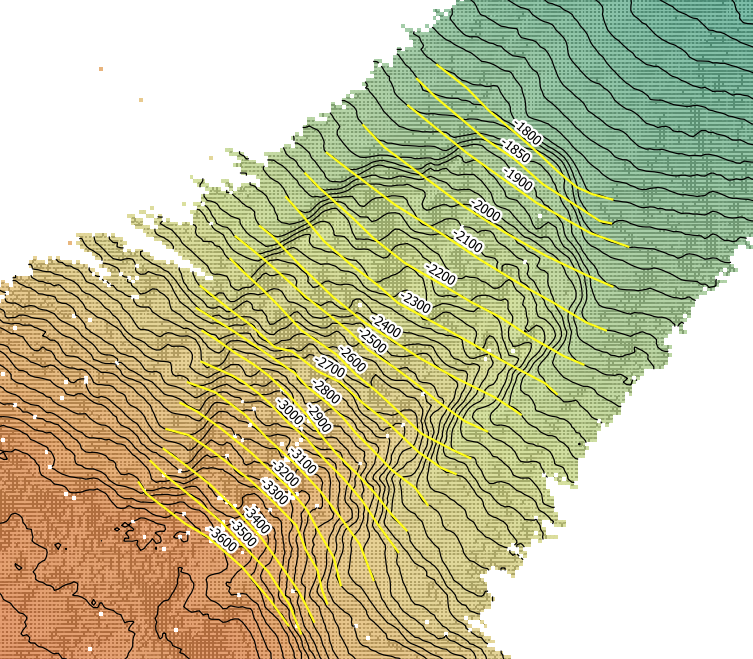
r.import input=mb.grd output=mb g.region raster=mbDigitalize the contourlines before the slide. I did the digitalization in QGIS and I saved the elevation values in field
levelv.import input=C:...\Contour50_WGS84.shp layer=Contour50_WGS84 output=Contour50_WGS84
v.import input=Contour50_WGS84.shp layer=Contour50_WGS84 output=Contour50_WGS84
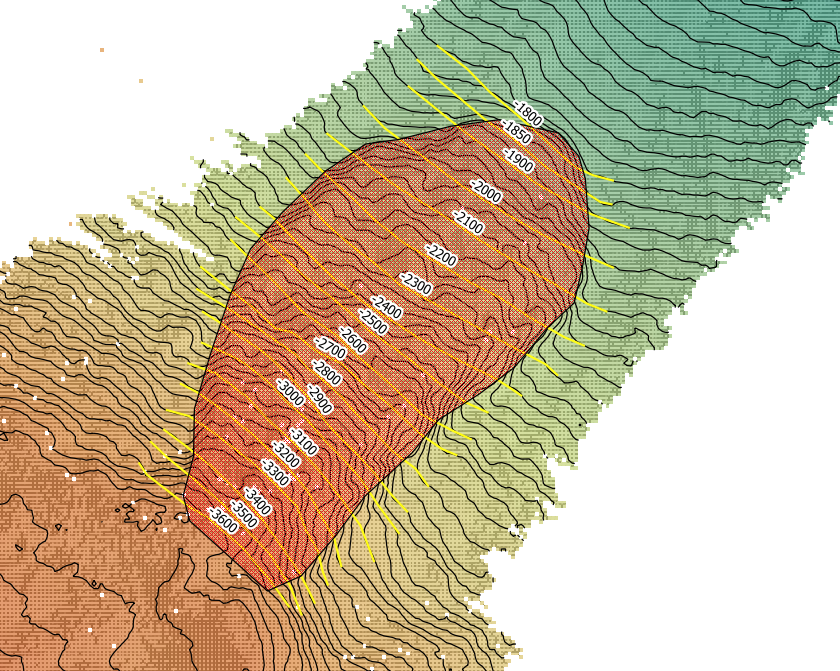
Digitalize the boundaries of the scarp to use it as a mask.
v.import input=C:...\mascara.shp layer=mascara output=mascara
v.import input=mascara.shp layer=mascara output=mascara
Mask the area of interest and fill the null values
r.mask --overwrite vector=mascara r.fillnulls input=mb output=mbfilled method=rst
r.mask --overwrite vector=mascara r.fillnulls input=mb output=mbfilled method=rstConversion of contour lines into raster lines and interpolation for the DTM prior the slide
v.to.rast input=Contour50_WGS84 type=line output=prescarp use=attr attribute_column=level r.surf.contour input=prescarp output=prescarpfilled
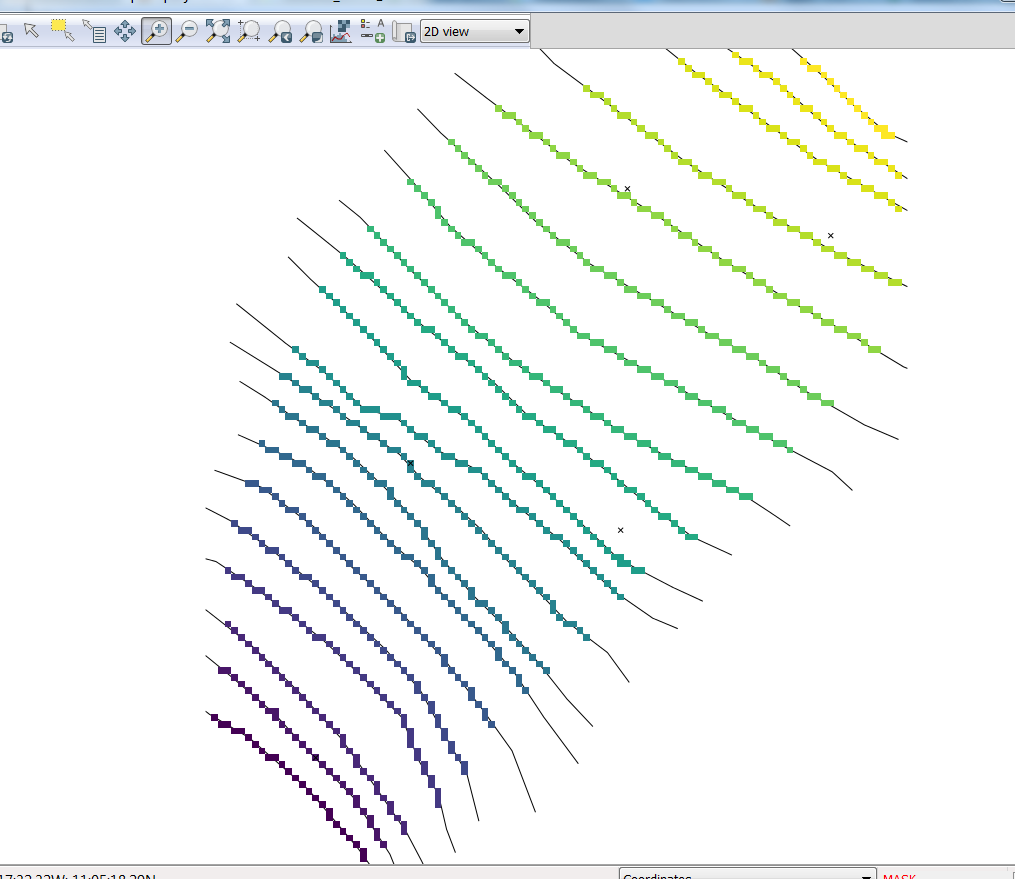
Calculate the difference between the two rasters
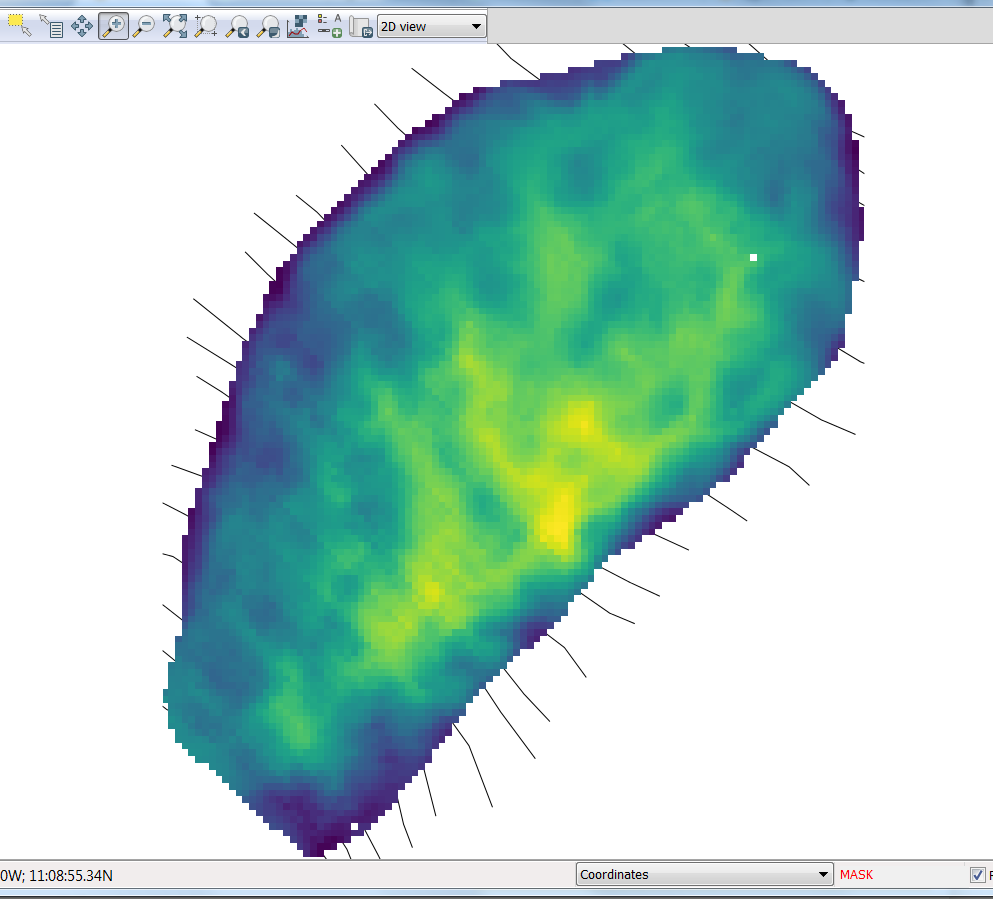
r.mapcalc expression=scarpdepth = prescarpfilled - mbfilled
v.to.rast input=Contour50_WGS84 type=line output=prescarp use=attr attribute_column=level r.surf.contour input=prescarp output=prescarpfilled
Calculate the difference between the two rasters
r.mapcalc expression=scarpdepth = prescarpfilled - mbfilled
- Calculate the average cell size and the sum of the
scarpdepthCalculate the average cell size and the sum of the
scarpdepthr.report map=MASK units=me |-----------------------------------------------------------------------------| | Category Information | square| |#|description | meters| |-----------------------------------------------------------------------------| |1|Value 1. . . . . . . . . . . . . . . . . . . . . . . . . . . | 53,830,997| |*|no data. . . . . . . . . . . . . . . . . . . . . . . . . . . |1,235,078,890| |-----------------------------------------------------------------------------| |TOTAL |1,288,909,887| +-----------------------------------------------------------------------------+r.univar map=scarpdepth total null and non-null cells: 178396 total null cells: 170947 Of the non-null cells: ----------------------n: 7449 minimum: -2.60534 maximum: 387.981 range: 390.586 mean: 206.303 mean of absolute values: 206.305 standard deviation: 76.9735 variance: 5924.92 variation coefficient: 37.3109 % sum: 1536751.12633864
r.report map=MASK units=me
|-----------------------------------------------------------------------------| | Category Information | square| |#|description | meters| |-----------------------------------------------------------------------------| |1|Value 1. . . . . . . . . . . . . . . . . . . . . . . . . . . | 53,830,997| |*|no data. . . . . . . . . . . . . . . . . . . . . . . . . . . |1,235,078,890| |-----------------------------------------------------------------------------| |TOTAL |1,288,909Then,887| +-----------------------------------------------------------------------------+
r.univar map=scarpdepth
total null and non-null cells: 178396
total null cells: 170947
Of the non-null cells:
----------------------
n: 7449
minimum: -2.60534
maximum: 387.981
range: 390.586
mean: 206.303
mean of absolute values: 206.305
standard deviation: 76.9735
variance: 5924.92
variation coefficient: 37.3109 %
sum: 1536751.12633864
Here with 7449 cells and an area of 53.8 km^2, the cell size is 7226 m^2/cell
- The volume approximately is 7+/-11 km^3 approximately (7,226 m^2 * 1,536,751 m = 11 km^3)

