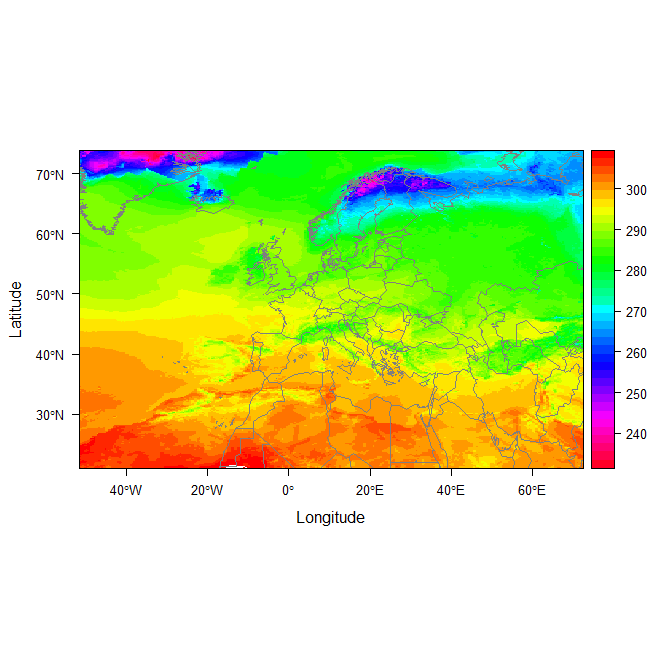
I don'tcan't manage to plot a raster and boundary of country (sp data frame) in the same plot. The data (lon,lat,value) are in mat data frame. The grid is not regular and comes from a climate change ncdf file.
Bumped by Community user
lambertj
- 3.1k
- 3
- 21
- 38

