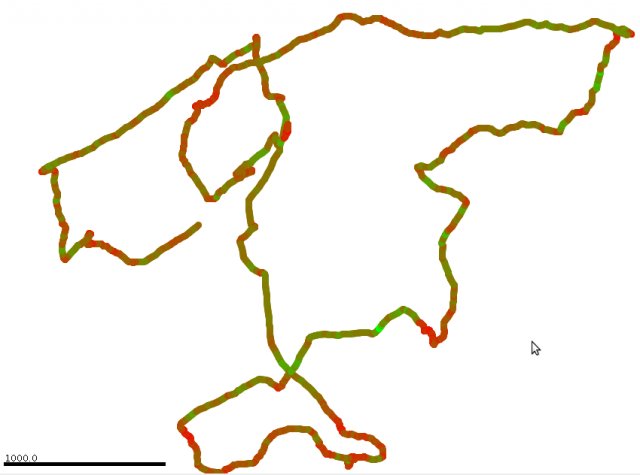
A commonsimple and efficient way is to color the segments depending on their speed (and not the points). For example, "fast" segments can be displayed in in green and "slow" segments in red (other colors can be chosen of course).
Example on an orienteering-running GPS trace using the software Chmuk allows to do that:

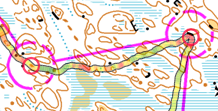
There is alsoAnother example with the software quickroute:

The parts of the route where the movement is fast are well visible, in green, compared to the ones where the movement is slow, in red.
In this example, the color scale is continuous: red is for the minimum speed, and green for the maximum. A finite set of colors can also be used, with different methods to assign a color to each segment according to its speed (like the quantile method for example). Many guys doing orienteering use that to analyse their speed variations during orienteering competitions. It should work for animals and vehicles!
Of course, this method is very simple (maybe 'simplistic') but very easy to implement. The balance between complexity and quality is rather good compared to other tricky representations. Moreover, there is no need to be a specialist to read and understand such map!
