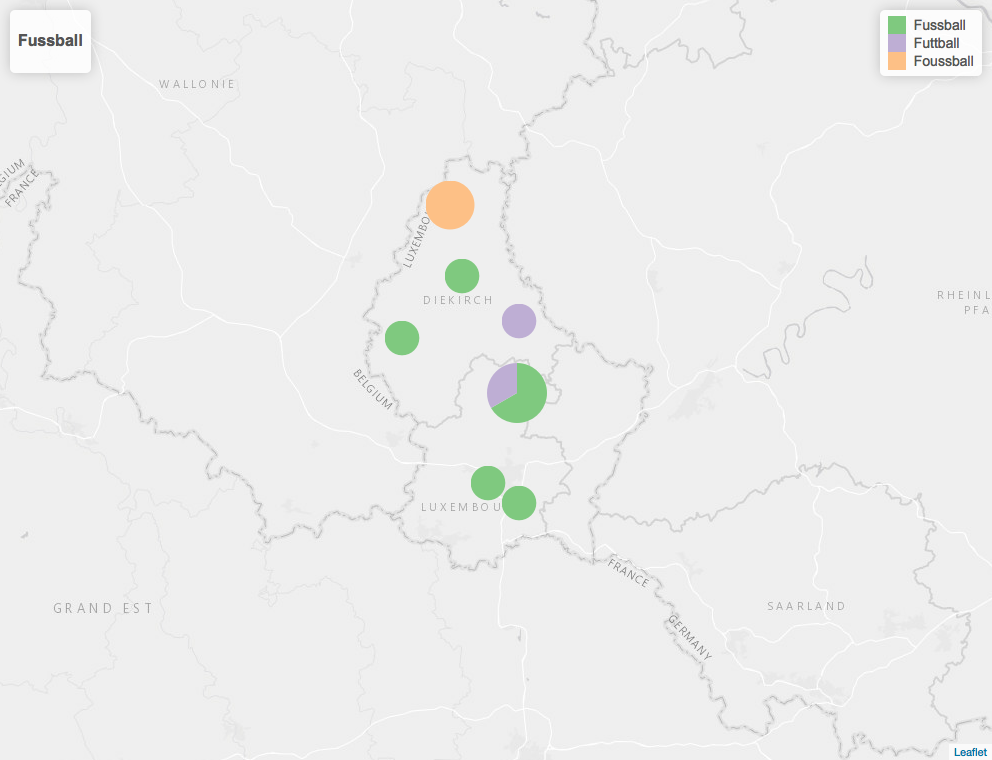
While trying to map some quantitative data with leafletin R, I manage to place pie-charts with leaflet.minichartson the map, like in the following example:
### data ###
d <- structure(list(
   area_name = c("Alscheid", "Alzingen", "Angelsberg", "Angelsberg", "Angelsberg", "Arsdorf","Asselborn", "Asselborn", "Baastenduerf", "Bartringen"),
   surveyID1 = c(1510L, 24L, 382L, 1429L, 1061L, 526L, 1524L, 1281L, 2169L, 1292L),
   Alter = c("25 bis 34", "25 bis 34", "15 bis 24", "15 bis 24", "25 bis 34", "15 bis 24", "35 bis 44", "35 bis 44", "25 bis 34", "25 bis 34"),
   latitude = c(49.970094, 49.56885, 49.76374, 49.76374, 49.76374, 49.860547, 50.09624, 50.09624, 49.891134, 49.6038), longitude = c(6.007703, 6.16394, 6.1592, 6.1592, 6.1592, 5.842195, 5.97425, 5.97425, 6.164145, 6.0782),
   count_all_variants = c(1, 1, 3, 3, 3, 1, 2, 2, 1, 1),
   var1 = c(1L, 1L, 2L, 3L, 3L, 1L, NA, NA, NA, 1L),
   var2 = c(NA, NA, 1L, NA, NA, NA, NA, NA, 1L, NA),
   var3 = c(NA, NA, NA, NA, NA, NA, 2L, 2L, NA, NA)),
   row.names = c(NA, 10L), class = "data.frame")

### mapping ###
library(leaflet)
library(leaflet.minicharts)

tilesURL <- "http://server.arcgisonline.com/ArcGIS/rest/services/Canvas/World_Light_Gray_Base/MapServer/tile/{z}/{y}/{x}"

title <- tags$div(HTML('<h3>Fussball</h3>'))
basemap <- leaflet(options = leafletOptions(zoomControl = FALSE, minZoom = 9, maxZoom = 10, dragging = T)) %>%
   addTiles(tilesURL) %>%
   fitBounds(6.1, 49.4426671413, 6.1, 50.1280516628) %>%
   addControl(title, position = "topleft")

colors <- c('#7fc97f','#beaed4','#fdc086')

basemap %>%
   addMinicharts(
   d$longitude, d$latitude,
   type = "pie",
   chartdata = d[, c("var1", "var2", "var3")],
   colorPalette = colors,
   popup=popupArgs(
   labels=c("Fussball", "Futtball", "Foussball"),
   html=paste0("<h3>", d$area_name, "</h3>",
               "ID: ", d$surveyID1, "<br>",
               "Alter: ", d$Alter
               )
   ),
   width = 60 * sqrt(d$count_all_variants) / sqrt(max(d$count_all_variants)), transitionTime = 0
)
In addition to that, I also would like to populate the popup window for each piechart with all the data for the respective location. For the moment, only one data row is displayed, showing 'area_name', 'surveyID1' and 'Alter'. Taking the location 'Angelsberg' as an example (in the middle of the map), I want the popup showing the data for all (3) data rows, which make up the piechart, i.e.:
<h3>Angelsberg</h3>
ID: 382 Alter: 15 bis 24<br>
ID: 1061 Alter: 15 bis 24<br>
ID: 526 Alter: 25 bis 34<br>
I assume that I have to pass some kind of list/array to html but I have no clue how to achieve this here.

