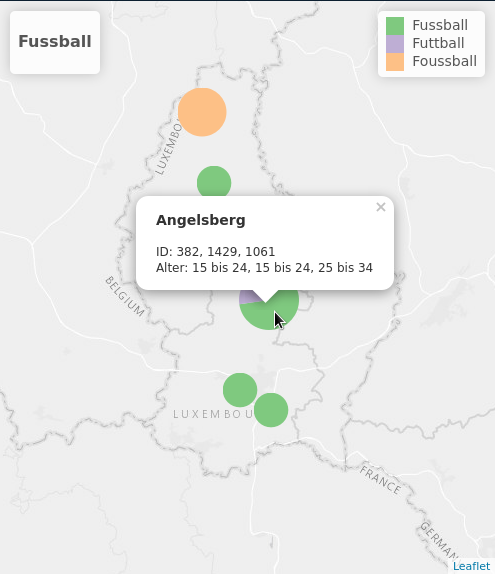
I think it's a conceptually problem first because you have repeated points with different data in the same location, e.g .: Angelsberg and Asselborn locations. So the popup from addMinicharts function will show you three pie charts in the same location and you can get only the most upper layer by clicking on it.
Briefly, I follow these steps:
- add
shiny library to use the tag element
- Transform the data: combine all the available data in each location/point
- Please check that I ran a mean function to aggregate the data in var1, var2 and var3: I don't think if this is correct. And that depends in the nature of your data.
Check the commented and reproducible code below.
### data ###
d <- structure(
  list(
    area_name = c(
      "Alscheid",
      "Alzingen",
      "Angelsberg",
      "Angelsberg",
      "Angelsberg",
      "Arsdorf",
      "Asselborn",
      "Asselborn",
      "Baastenduerf",
      "Bartringen"
    ),
    surveyID1 = c(1510L, 24L, 382L, 1429L, 1061L, 526L, 1524L, 1281L, 2169L, 1292L),
    Alter = c(
      "25 bis 34",
      "25 bis 34",
      "15 bis 24",
      "15 bis 24",
      "25 bis 34",
      "15 bis 24",
      "35 bis 44",
      "35 bis 44",
      "25 bis 34",
      "25 bis 34"
    ),
    latitude = c(
      49.970094,
      49.56885,
      49.76374,
      49.76374,
      49.76374,
      49.860547,
      50.09624,
      50.09624,
      49.891134,
      49.6038
    ),
    longitude = c(
      6.007703,
      6.16394,
      6.1592,
      6.1592,
      6.1592,
      5.842195,
      5.97425,
      5.97425,
      6.164145,
      6.0782
    ),
    count_all_variants = c(1, 1, 3, 3, 3, 1, 2, 2, 1, 1),
    var1 = c(1L, 1L, 2L, 3L, 3L, 1L, NA, NA, NA, 1L),
    var2 = c(NA, NA, 1L, NA, NA, NA, NA, NA, 1L, NA),
    var3 = c(NA, NA, NA, NA, NA, NA, 2L, 2L, NA, NA)
  ),
  row.names = c(NA, 10L),
  class = "data.frame"
)


# Transform data

# Load simple features object management library
library(sf)

# Convert to simple feature collection object (points)
d2 <- st_as_sf(d, coords = c("longitude", "latitude"))

# Get intersection of the same object
d3 <- st_intersection(d2)

# See origins columns (which elements intersects)
d3$origins

list <- lapply(1:length(d3$origins), function(x) {
  point <- d3[x, ]
  point$surveyID1 <-
    stringr::str_flatten(d2[d3$origins[[x]], ]$surveyID1, collapse = ", ")
  point$Alter <-
    stringr::str_flatten(d2[d3$origins[[x]], ]$Alter, collapse = ", ")
  point$var1 <- mean(d2[d3$origins[[x]], ]$var1, na.rm = TRUE)
  point$var2 <- mean(d2[d3$origins[[x]], ]$var2, na.rm = TRUE)
  point$var3 <- mean(d2[d3$origins[[x]], ]$var3, na.rm = TRUE)

  return(point)

})

# Bind list points
new_d <- do.call(rbind, list)
print(class(new_d)) # simple features object

# Add lat and long data as columns
new_d$longitude <- st_coordinates(new_d)[, "X"]
new_d$latitude <- st_coordinates(new_d)[, "Y"]

# Transform to data frame adding null to geometries
st_geometry(new_d) <- NULL
print(class(new_d))

### mapping ###
library(leaflet)
library(leaflet.minicharts)

tilesURL <-
  "http://server.arcgisonline.com/ArcGIS/rest/services/Canvas/World_Light_Gray_Base/MapServer/tile/{z}/{y}/{x}"

title <-
  shiny::tags$div(HTML('<h3>Fussball</h3>')) # add shiny library to use "tags"
basemap <-
  leaflet(options = leafletOptions(
    zoomControl = FALSE,
    minZoom = 9,
    maxZoom = 10,
    dragging = T
  )) %>%
  addTiles(tilesURL) %>%
  fitBounds(6.1, 49.4426671413, 6.1, 50.1280516628) %>%
  addControl(title, position = "topleft")

colors <- c('#7fc97f', '#beaed4', '#fdc086')

basemap %>%
  addMinicharts(
    new_d$longitude,
    new_d$latitude,
    type = "pie",
    chartdata = new_d[, c("var1", "var2", "var3")],
    colorPalette = colors,
    popup = popupArgs(
      labels = c("Fussball", "Futtball", "Foussball"),
      html = paste0(
        "<div>",
        "<h3>",
        new_d$area_name,
        "</h3>",
        "ID: ",
        new_d$surveyID1,
        "<br>",
        "Alter: ",
        new_d$Alter,
        "</div>"
      )
    ),
    width = 60 * sqrt(new_d$count_all_variants) / sqrt(max(new_d$count_all_variants)),
    transitionTime = 0
  )


