added 1 character in body
Source Link
Andre Silva
  • 10.3k
  • 12
  • 55
  • 109

QGIS does not currently have a really good way to visualize point cloud data (i.e. as of 2018). Instead, I would recommend the excellent, open source plas.io web app. plas.io allows you to visualize the point cloud data with the ability to adjust particle size, point density, intensity, color, and a host of other features.

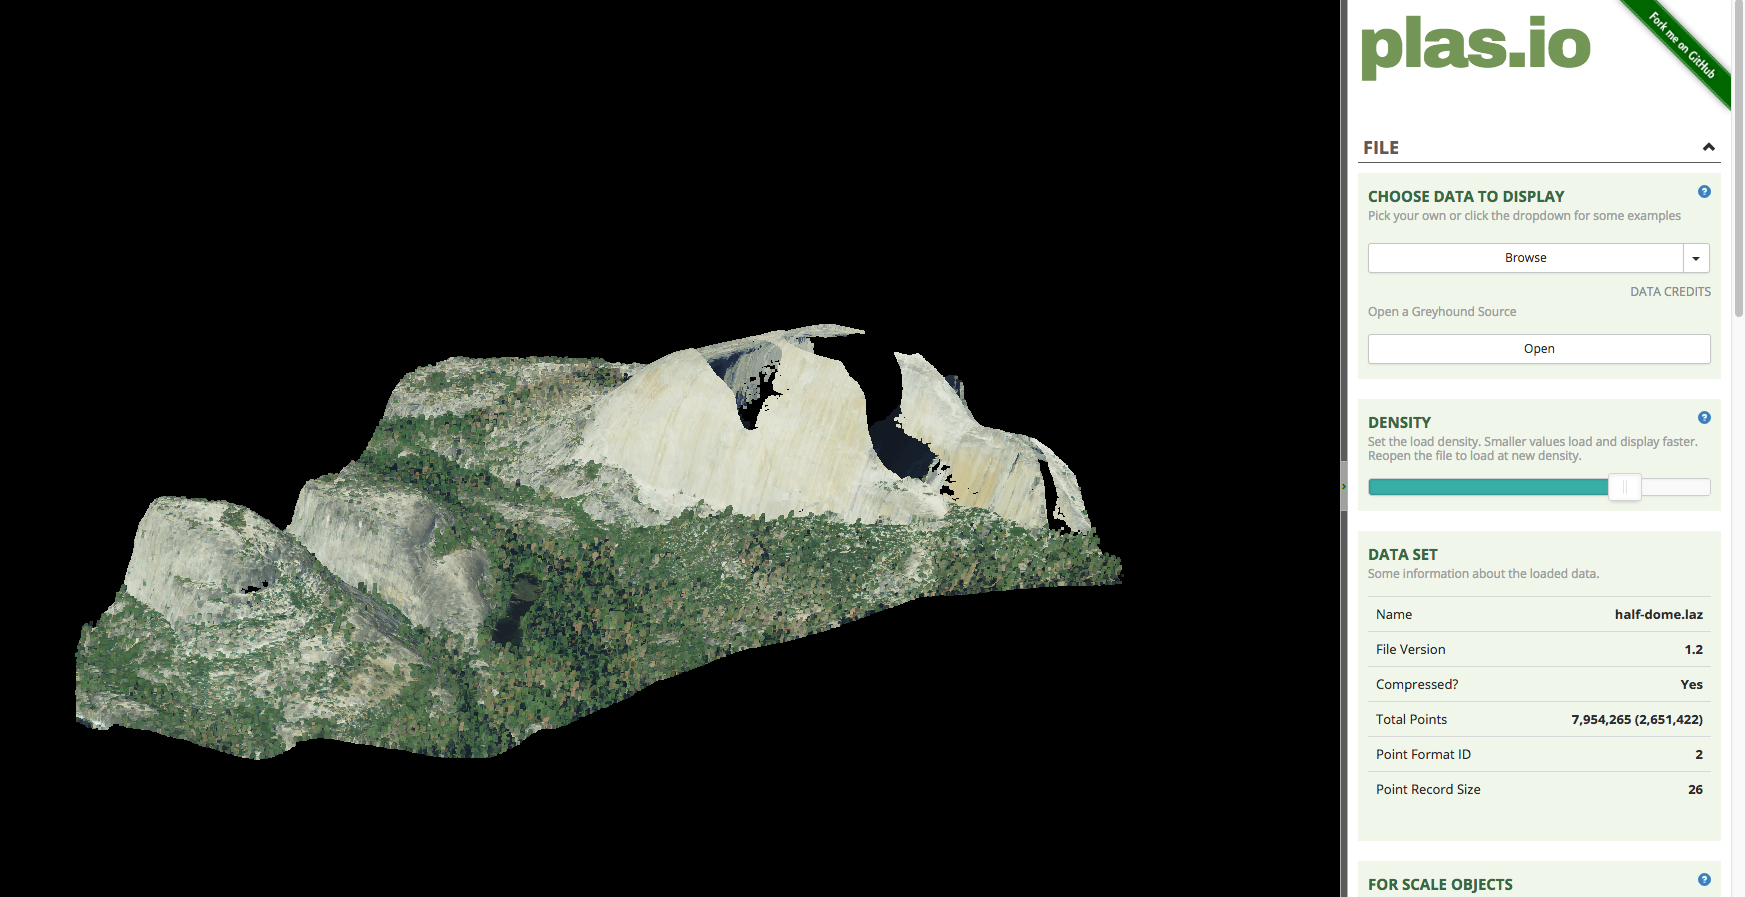
For example, the screenshot howsshows a point cloud visualization of Half Dome in Yosemite NP. I typically use the web app to visually scan the point cloud data to check for things such as scan line overlap and point density prior to processing.

enter image description here

QGIS does not currently have a really good way to visualize point cloud data (i.e. as of 2018). Instead, I would recommend the excellent, open source plas.io web app. plas.io allows you to visualize the point cloud data with the ability to adjust particle size, point density, intensity, color, and a host of other features.

For example, the screenshot hows a point cloud visualization of Half Dome in Yosemite NP. I typically use the web app to visually scan the point cloud data to check for things such as scan line overlap and point density prior to processing.

enter image description here

QGIS does not currently have a really good way to visualize point cloud data (i.e. as of 2018). Instead, I would recommend the excellent, open source plas.io web app. plas.io allows you to visualize the point cloud data with the ability to adjust particle size, point density, intensity, color, and a host of other features.

For example, the screenshot shows a point cloud visualization of Half Dome in Yosemite NP. I typically use the web app to visually scan the point cloud data to check for things such as scan line overlap and point density prior to processing.

enter image description here

added 20 characters in body
Source Link
Aaron
  • 51.8k
  • 29
  • 157
  • 322

QGIS does not currently have a really good way to visualize point cloud data (i.e. as of 2018). Instead, I would recommend the excellent, open source plas.io web app. plas.io allows you to visualize the point cloud data with the ability to adjust particle size, point density, intensity, color, and a host of other features.

For example, the screenshot hows a point cloud visualization of Half Dome in Yosemite NP. I typically use the web app to visually scan the point cloud data to check for things such as scan line overlap and point density prior to processing.

enter image description here

QGIS does not currently have a really good way to visualize point cloud data (i.e. as of 2018). Instead, I would recommend the excellent, open source plas.io web app. plas.io allows you to visualize the point cloud data with the ability to adjust particle size, point density, intensity, color, and a host of other features.

For example, the screenshot hows a point cloud visualization of Half Dome in Yosemite NP. I typically use the web app to visually scan the point cloud data to check for things such as scan line overlap and point density.

enter image description here

QGIS does not currently have a really good way to visualize point cloud data (i.e. as of 2018). Instead, I would recommend the excellent, open source plas.io web app. plas.io allows you to visualize the point cloud data with the ability to adjust particle size, point density, intensity, color, and a host of other features.

For example, the screenshot hows a point cloud visualization of Half Dome in Yosemite NP. I typically use the web app to visually scan the point cloud data to check for things such as scan line overlap and point density prior to processing.

enter image description here

Source Link
Aaron
  • 51.8k
  • 29
  • 157
  • 322

QGIS does not currently have a really good way to visualize point cloud data (i.e. as of 2018). Instead, I would recommend the excellent, open source plas.io web app. plas.io allows you to visualize the point cloud data with the ability to adjust particle size, point density, intensity, color, and a host of other features.

For example, the screenshot hows a point cloud visualization of Half Dome in Yosemite NP. I typically use the web app to visually scan the point cloud data to check for things such as scan line overlap and point density.

enter image description here