added 7 characters in body
Source Link
Roy
  • 4k
  • 4
  • 32
  • 55

ArcMap just orders based on geometry type: 1. Points, 2. Lines, 3. Polygons.

My suggestion is to use transparency to help you symbolize these overlapping features. Take a look at a color wheel when you're selecting colors and choose colors that have good additive properties.
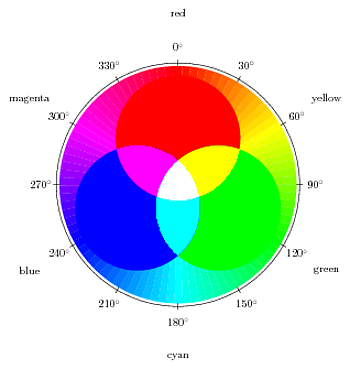
enter image description here

By using this technique you'll be able to identify the individual layers and areas where they overlap. Adjust your transparency accordingly.

If the polygon boundaries overlap EXACTLY, your best bet might be to add a depth value into the attribute table. Then, which you could use ArcScene andto visualize your data in 3D.

ArcMap just orders based on geometry type: 1. Points, 2. Lines, 3. Polygons.

My suggestion is to use transparency to help you symbolize these overlapping features. Take a look at a color wheel when you're selecting colors and choose colors that have good additive properties.

enter image description here

By using this technique you'll be able to identify the individual layers and areas where they overlap. Adjust your transparency accordingly.

If the polygon boundaries overlap EXACTLY, your best bet might be to add depth into the attribute table. Then you could use ArcScene and visualize your data in 3D.

ArcMap just orders based on geometry type: 1. Points, 2. Lines, 3. Polygons.

My suggestion is to use transparency to help you symbolize these overlapping features. Take a look at a color wheel when you're selecting colors and choose colors that have good additive properties.

enter image description here

By using this technique you'll be able to identify the individual layers and areas where they overlap. Adjust your transparency accordingly.

If the polygon boundaries overlap EXACTLY, your best bet might be to add a depth value into the attribute table, which you could use ArcScene to visualize your data in 3D.

Source Link
Roy
  • 4k
  • 4
  • 32
  • 55

ArcMap just orders based on geometry type: 1. Points, 2. Lines, 3. Polygons.

My suggestion is to use transparency to help you symbolize these overlapping features. Take a look at a color wheel when you're selecting colors and choose colors that have good additive properties.

enter image description here

By using this technique you'll be able to identify the individual layers and areas where they overlap. Adjust your transparency accordingly.

If the polygon boundaries overlap EXACTLY, your best bet might be to add depth into the attribute table. Then you could use ArcScene and visualize your data in 3D.