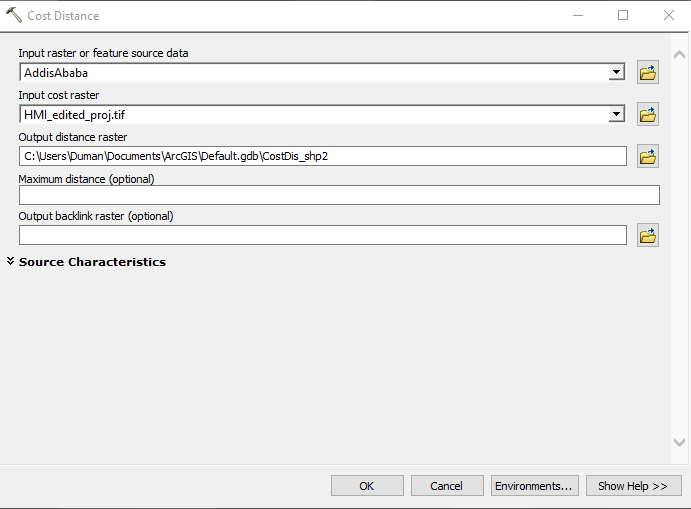
I have a raster data where pixel value of each cell represents the potential minimum travel time across the cell in old world. I need to find the minimum travel time of some points from Addis Ababa (Ethiopia) in ArcMap.
So I use Cost Distance to generate the raster with the least accumulative travel time for each cell. However, the generated raster doesn't make sense. For example, in the original raster, the source cell (i.e. including Addis Ababa) has the value of 0.263932, and its neighbor cell has the value of 0.194596, but the pixel value of the neighbor cell in the generated raster is 0.003143 !!!
I am using ArcMap 10.6. The coordinate system of the raster data is WGS_1984.
What am I doing wrong? Here is a screen shot of the tool.

