Cleaned up code
Source Link
Aaron
  • 51.8k
  • 29
  • 157
  • 321

One common approach is to first apply a circular buffer and then apply an envelope (i.e. smallest rectangular polygon that contains each object).

Here is how you can create square buffers using geopandas GeoSeries.envelope (source). Note that geometric operations in geopandas are performed by shapely.

import pandas as pd
import geopandas as gpd
from shapely.geometry import Point
import matplotlib.pyplot as plt

# Generate some sample data 
p1 = Point((1,2))
p2 = Point((5,6))
df = pd.DataFrame({'a': [11,22]}8))
gdfpoints = gpd.GeoDataFrameGeoSeries(df, geometry = [p1,p2])
gdf.plot()

enter image description here

# Buffer the points byusing a square cap style
# Note cap_style: round = 1, flat = 2, unitssquare = 3
buffer = gdfpoints.buffer(2, cap_style = 3)
buffer.plot()

enter image description here

# Apply an envelope aroundPlot circularthe buffersresults
envelopefig, ax1 = plt.subplots()
buffer.envelopeboundary.plot(ax=ax1, color = 'slategrey')
envelopepoints.plot(ax = ax1, color = 'red')

enter image description hereenter image description here

One common approach is to first apply a circular buffer and then apply an envelope (i.e. smallest rectangular polygon that contains each object).

Here is how you can create square buffers using geopandas GeoSeries.envelope (source). Note that geometric operations in geopandas are performed by shapely.

import pandas as pd
import geopandas as gpd
from shapely.geometry import Point
import matplotlib.pyplot as plt

# Generate some sample data 
p1 = Point((1,2))
p2 = Point((5,6))
df = pd.DataFrame({'a': [11,22]})
gdf = gpd.GeoDataFrame(df, geometry = [p1,p2])
gdf.plot()

enter image description here

# Buffer the points by 2 units
buffer = gdf.buffer(2)
buffer.plot()

enter image description here

# Apply an envelope around circular buffers
envelope = buffer.envelope  
envelope.plot()

enter image description here

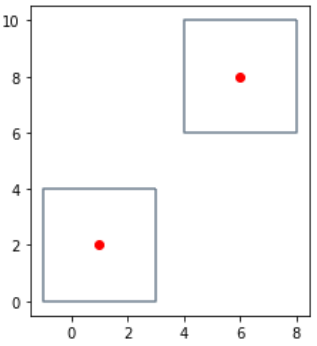
Here is how you can create square buffers using geopandas. Note that geometric operations in geopandas are performed by shapely.

import geopandas as gpd
from shapely.geometry import Point
import matplotlib.pyplot as plt

# Generate some sample data 
p1 = Point((1,2))
p2 = Point((6,8))
points = gpd.GeoSeries([p1,p2])

# Buffer the points using a square cap style
# Note cap_style: round = 1, flat = 2, square = 3
buffer = points.buffer(2, cap_style = 3)

# Plot the results
fig, ax1 = plt.subplots()
buffer.boundary.plot(ax=ax1, color = 'slategrey')
points.plot(ax = ax1, color = 'red')

enter image description here

deleted 17 characters in body
Source Link
Aaron
  • 51.8k
  • 29
  • 157
  • 321

One approach common to many packagesapproach is to first apply a circular buffer and then apply an envelope (i.e. smallest rectangular polygon that contains each object).

Here is how you can create square buffers using geopandas GeoSeries.envelope (source). Note that geometric operations in geopandas are performed by shapely.

import pandas as pd
import geopandas as gpd
from shapely.geometry import Point
import matplotlib.pyplot as plt

# Generate some sample data 
p1 = Point((1,2))
p2 = Point((5,6))
df = pd.DataFrame({'a': [11,22]})
gdf = gpd.GeoDataFrame(df, geometry = [p1,p2])
gdf.plot()

enter image description here

# Buffer the points by 2 units
buffer = gdf.buffer(2)
buffer.plot()

enter image description here

# Apply an envelope around circular buffers
envelope = buffer.envelope  
envelope.plot()

enter image description here

One approach common to many packages is to first apply a circular buffer and then apply an envelope (i.e. smallest rectangular polygon that contains each object).

Here is how you can create square buffers using geopandas GeoSeries.envelope (source). Note that geometric operations in geopandas are performed by shapely.

import pandas as pd
import geopandas as gpd
from shapely.geometry import Point
import matplotlib.pyplot as plt

# Generate some sample data 
p1 = Point((1,2))
p2 = Point((5,6))
df = pd.DataFrame({'a': [11,22]})
gdf = gpd.GeoDataFrame(df, geometry = [p1,p2])
gdf.plot()

enter image description here

# Buffer the points by 2 units
buffer = gdf.buffer(2)
buffer.plot()

enter image description here

# Apply an envelope around circular buffers
envelope = buffer.envelope  
envelope.plot()

enter image description here

One common approach is to first apply a circular buffer and then apply an envelope (i.e. smallest rectangular polygon that contains each object).

Here is how you can create square buffers using geopandas GeoSeries.envelope (source). Note that geometric operations in geopandas are performed by shapely.

import pandas as pd
import geopandas as gpd
from shapely.geometry import Point
import matplotlib.pyplot as plt

# Generate some sample data 
p1 = Point((1,2))
p2 = Point((5,6))
df = pd.DataFrame({'a': [11,22]})
gdf = gpd.GeoDataFrame(df, geometry = [p1,p2])
gdf.plot()

enter image description here

# Buffer the points by 2 units
buffer = gdf.buffer(2)
buffer.plot()

enter image description here

# Apply an envelope around circular buffers
envelope = buffer.envelope  
envelope.plot()

enter image description here

added 70 characters in body
Source Link
Aaron
  • 51.8k
  • 29
  • 157
  • 321

One approach common to many packages is to first apply a circular buffer and then apply an envelope (i.e. smallest rectangular polygon that contains each object).

Here is how you can create square buffers using geopandas GeoSeries.envelope (source):. Note that geometric operations in geopandas are performed by shapely.

import pandas as pd
import geopandas as gpd
from shapely.geometry import Point
import matplotlib.pyplot as plt

# Generate some sample data 
p1 = Point((1,2))
p2 = Point((5,6))
df = pd.DataFrame({'a': [11,22]})
gdf = gpd.GeoDataFrame(df, geometry = [p1,p2])
gdf.plot()

enter image description here

# Buffer the points by 2 units
buffer = gdf.buffer(2)
buffer.plot()

enter image description here

# Apply an envelope around circular buffers
envelope = buffer.envelope  
envelope.plot()

enter image description here

One approach common to many packages is to first apply a circular buffer and then apply an envelope (i.e. smallest rectangular polygon that contains each object).

Here is how you can create square buffers using geopandas GeoSeries.envelope (source):

import pandas as pd
import geopandas as gpd
from shapely.geometry import Point
import matplotlib.pyplot as plt

# Generate some sample data 
p1 = Point((1,2))
p2 = Point((5,6))
df = pd.DataFrame({'a': [11,22]})
gdf = gpd.GeoDataFrame(df, geometry = [p1,p2])
gdf.plot()

enter image description here

# Buffer the points by 2 units
buffer = gdf.buffer(2)
buffer.plot()

enter image description here

# Apply an envelope around circular buffers
envelope = buffer.envelope  
envelope.plot()

enter image description here

One approach common to many packages is to first apply a circular buffer and then apply an envelope (i.e. smallest rectangular polygon that contains each object).

Here is how you can create square buffers using geopandas GeoSeries.envelope (source). Note that geometric operations in geopandas are performed by shapely.

import pandas as pd
import geopandas as gpd
from shapely.geometry import Point
import matplotlib.pyplot as plt

# Generate some sample data 
p1 = Point((1,2))
p2 = Point((5,6))
df = pd.DataFrame({'a': [11,22]})
gdf = gpd.GeoDataFrame(df, geometry = [p1,p2])
gdf.plot()

enter image description here

# Buffer the points by 2 units
buffer = gdf.buffer(2)
buffer.plot()

enter image description here

# Apply an envelope around circular buffers
envelope = buffer.envelope  
envelope.plot()

enter image description here

Source Link
Aaron
  • 51.8k
  • 29
  • 157
  • 321
Loading