added 747 characters in body
Source Link
Spacedman
  • 66.5k
  • 6
  • 83
  • 121

Here's code that follows what you are doing.

First make a raster like your source:

source = raster(nrow = 467, ncol = 805, 
     xmn=-119, xmx=-85.45833, ymn=13.54167, ymx=33)
crs(source) = "+proj=longlat +datum=WGS84 +no_defs +ellps=WGS84 +towgs84=0,0,0"

Fill it with zeroes plus a diagonal line of 99s so we can test alignments:

source[] = 0
source[seq(1,ncell(source),by=806)] = 99
plot(source)

Now the target and the projection to the destination:

target <- raster(nrow=2335, ncol=4025, extent(source), crs(source)) 
dest <- projectRaster(source, target, method='bilinear', tolerance=0.0001)

Sanity check:

> extent(dest) == extent(source)
[1] TRUE

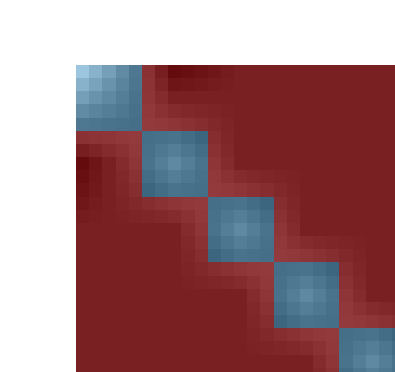
Now its hard to visualise two rasters on top of each other in R so I exported them to QGIS and coloured and overlaid them. Look at this image extreme-zoomed in to the raster in order to show what is going on at the pixel level:

enter image description here

The blue/red is showing five pixels from the source raster - you can see the pixel edges. The fuzzy shading is a transparent overlay of the dest raster. Note how the bilinear filtering is smearing out each pixel into a rough square of pixels, and that they align perfectly with the centre of each source pixel. There are no alignment problems.

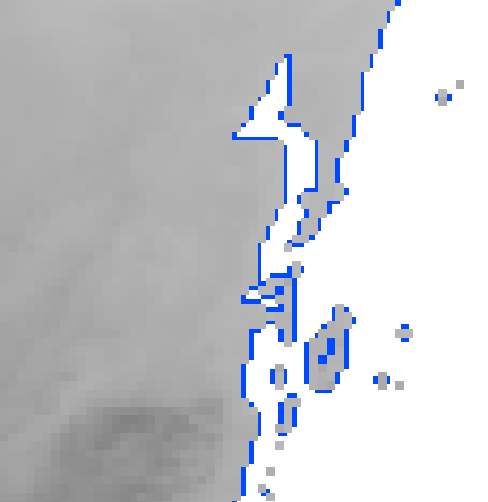
WithoutIf I do this with your data or some data you can share that shows your problemand then overlay them (suitably Y-flipped) there's no systematic shift showing up as a colour fringe on one side, I don't see how I can take this any furtherbut there is a slight expansion of the land caused by the smoothing filter, which shows equally on all sides. I've coloured the underlying raster pure blue so it looks even worse than it would if the underlying raster was gray-shaded. This looks totally as expected:

enter image description here

Here's the exact code that produced those rasters:

source=raster("./January6690_mean.tif")
target <- raster(nrow=2335, ncol=4025, extent(source), crs(source)) 
dest <- projectRaster(source, target, method='bilinear', tolerance=0.0001)
writeRaster(flip(dest, direction='y'), "flipdest.tif")
writeRaster(flip(source, direction='y'), "flipsource.tif")

Here's code that follows what you are doing.

First make a raster like your source:

source = raster(nrow = 467, ncol = 805, 
     xmn=-119, xmx=-85.45833, ymn=13.54167, ymx=33)
crs(source) = "+proj=longlat +datum=WGS84 +no_defs +ellps=WGS84 +towgs84=0,0,0"

Fill it with zeroes plus a diagonal line of 99s so we can test alignments:

source[] = 0
source[seq(1,ncell(source),by=806)] = 99
plot(source)

Now the target and the projection to the destination:

target <- raster(nrow=2335, ncol=4025, extent(source), crs(source)) 
dest <- projectRaster(source, target, method='bilinear', tolerance=0.0001)

Sanity check:

> extent(dest) == extent(source)
[1] TRUE

Now its hard to visualise two rasters on top of each other in R so I exported them to QGIS and coloured and overlaid them. Look at this image extreme-zoomed in to the raster in order to show what is going on at the pixel level:

enter image description here

The blue/red is showing five pixels from the source raster - you can see the pixel edges. The fuzzy shading is a transparent overlay of the dest raster. Note how the bilinear filtering is smearing out each pixel into a rough square of pixels, and that they align perfectly with the centre of each source pixel. There are no alignment problems.

Without your data or some data you can share that shows your problem, I don't see how I can take this any further.

Here's code that follows what you are doing.

First make a raster like your source:

source = raster(nrow = 467, ncol = 805, 
     xmn=-119, xmx=-85.45833, ymn=13.54167, ymx=33)
crs(source) = "+proj=longlat +datum=WGS84 +no_defs +ellps=WGS84 +towgs84=0,0,0"

Fill it with zeroes plus a diagonal line of 99s so we can test alignments:

source[] = 0
source[seq(1,ncell(source),by=806)] = 99
plot(source)

Now the target and the projection to the destination:

target <- raster(nrow=2335, ncol=4025, extent(source), crs(source)) 
dest <- projectRaster(source, target, method='bilinear', tolerance=0.0001)

Sanity check:

> extent(dest) == extent(source)
[1] TRUE

Now its hard to visualise two rasters on top of each other in R so I exported them to QGIS and coloured and overlaid them. Look at this image extreme-zoomed in to the raster in order to show what is going on at the pixel level:

enter image description here

The blue/red is showing five pixels from the source raster - you can see the pixel edges. The fuzzy shading is a transparent overlay of the dest raster. Note how the bilinear filtering is smearing out each pixel into a rough square of pixels, and that they align perfectly with the centre of each source pixel. There are no alignment problems.

If I do this with your data and then overlay them (suitably Y-flipped) there's no systematic shift showing up as a colour fringe on one side, but there is a slight expansion of the land caused by the smoothing filter, which shows equally on all sides. I've coloured the underlying raster pure blue so it looks even worse than it would if the underlying raster was gray-shaded. This looks totally as expected:

enter image description here

Here's the exact code that produced those rasters:

source=raster("./January6690_mean.tif")
target <- raster(nrow=2335, ncol=4025, extent(source), crs(source)) 
dest <- projectRaster(source, target, method='bilinear', tolerance=0.0001)
writeRaster(flip(dest, direction='y'), "flipdest.tif")
writeRaster(flip(source, direction='y'), "flipsource.tif")
added 146 characters in body
Source Link
Spacedman
  • 66.5k
  • 6
  • 83
  • 121

Why are you changing the origin of target? That is going to misalign your rasters.

I thinkHere's code that follows what you are trying to do is get an output with a desired resolution (0.00833333) and a desired number of rows and columns and have it exactly overlap another raster. If the resolution times the number of rows and columns doesn't exactly span the width and height of the extent you want to match then you can't do thisdoing.

If I run your code without setting the origin I getFirst make a final outputraster like thisyour source:

> extent(dest)
classsource = raster(nrow = 467, ncol := Extent805, 
xmin       : xmn=-119 
xmax       :, xmx=-85.45833 
ymin       :, 13ymn=13.54167, ymx=33)
ymax   crs(source) = "+proj=longlat +datum=WGS84 :+no_defs 33+ellps=WGS84 +towgs84=0,0,0"

which is the same as the input rasterFill it with zeroes plus a diagonal line of 99s so we can test alignments:

>source[] extent= 0
source[seq(dest1,ncell(source),by=806)] === extent99
plot(source)
[1] TRUE

but if I mess upNow the origin as in your code then it doesn't matchtarget and the projection to the destination:

> extent(dest2)
class      : Extent 
xmin       :target <-119 
xmax       : -85.45833 
ymin     raster(nrow=2335, ncol=4025, :extent(source), 13.54164crs(source)) 
ymax   dest <- projectRaster(source, target, :method='bilinear', 32tolerance=0.99997 0001)

Sanity check:

> extent(dest2dest) == extent(targetsource)
[1] FALSETRUE

You can't freely define all threeNow its hard to visualise two rasters on top of resolution (cell size), dimension (cell count)each other in R so I exported them to QGIS and extent (raster width). Define twocoloured and overlaid them. Look at this image extreme-zoomed in to the third oneraster in order to show what is setgoing on at the pixel level:

enter image description here

The blue/red is showing five pixels from the source raster - you can see the pixel edges. What you've doneThe fuzzy shading is define resolution and dimension, soa transparent overlay of the extentdest raster. Note how the bilinear filtering is not what you wantedsmearing out each pixel into a rough square of pixels, and that they align perfectly with the centre of each source pixel. There are no alignment problems.

Without setting originyour data or some data you can share that shows your problem, I define extent and dimension so my resolution is differentdon't see how I can take this any further.

Why are you changing the origin of target? That is going to misalign your rasters.

I think what you are trying to do is get an output with a desired resolution (0.00833333) and a desired number of rows and columns and have it exactly overlap another raster. If the resolution times the number of rows and columns doesn't exactly span the width and height of the extent you want to match then you can't do this.

If I run your code without setting the origin I get a final output like this:

> extent(dest)
class      : Extent 
xmin       : -119 
xmax       : -85.45833 
ymin       : 13.54167 
ymax       : 33 

which is the same as the input raster:

> extent(dest) == extent(source)
[1] TRUE

but if I mess up the origin as in your code then it doesn't match:

> extent(dest2)
class      : Extent 
xmin       : -119 
xmax       : -85.45833 
ymin       : 13.54164 
ymax       : 32.99997 
> extent(dest2) == extent(target)
[1] FALSE

You can't freely define all three of resolution (cell size), dimension (cell count) and extent (raster width). Define two and the third one is set. What you've done is define resolution and dimension, so the extent is not what you wanted. Without setting origin I define extent and dimension so my resolution is different.

Here's code that follows what you are doing.

First make a raster like your source:

source = raster(nrow = 467, ncol = 805, 
     xmn=-119, xmx=-85.45833, ymn=13.54167, ymx=33)
crs(source) = "+proj=longlat +datum=WGS84 +no_defs +ellps=WGS84 +towgs84=0,0,0"

Fill it with zeroes plus a diagonal line of 99s so we can test alignments:

source[] = 0
source[seq(1,ncell(source),by=806)] = 99
plot(source)

Now the target and the projection to the destination:

target <- raster(nrow=2335, ncol=4025, extent(source), crs(source)) 
dest <- projectRaster(source, target, method='bilinear', tolerance=0.0001)

Sanity check:

> extent(dest) == extent(source)
[1] TRUE

Now its hard to visualise two rasters on top of each other in R so I exported them to QGIS and coloured and overlaid them. Look at this image extreme-zoomed in to the raster in order to show what is going on at the pixel level:

enter image description here

The blue/red is showing five pixels from the source raster - you can see the pixel edges. The fuzzy shading is a transparent overlay of the dest raster. Note how the bilinear filtering is smearing out each pixel into a rough square of pixels, and that they align perfectly with the centre of each source pixel. There are no alignment problems.

Without your data or some data you can share that shows your problem, I don't see how I can take this any further.

Source Link
Spacedman
  • 66.5k
  • 6
  • 83
  • 121

Why are you changing the origin of target? That is going to misalign your rasters.

I think what you are trying to do is get an output with a desired resolution (0.00833333) and a desired number of rows and columns and have it exactly overlap another raster. If the resolution times the number of rows and columns doesn't exactly span the width and height of the extent you want to match then you can't do this.

If I run your code without setting the origin I get a final output like this:

> extent(dest)
class      : Extent 
xmin       : -119 
xmax       : -85.45833 
ymin       : 13.54167 
ymax       : 33 

which is the same as the input raster:

> extent(dest) == extent(source)
[1] TRUE

but if I mess up the origin as in your code then it doesn't match:

> extent(dest2)
class      : Extent 
xmin       : -119 
xmax       : -85.45833 
ymin       : 13.54164 
ymax       : 32.99997 
> extent(dest2) == extent(target)
[1] FALSE

You can't freely define all three of resolution (cell size), dimension (cell count) and extent (raster width). Define two and the third one is set. What you've done is define resolution and dimension, so the extent is not what you wanted. Without setting origin I define extent and dimension so my resolution is different.