Commonmark migration
Source Link

I need some terminology help as I am still learning GIS.

I have two datasets. One with the address of every fire and it's latitude/longitude of small census tract. One with the location of every parcel of land (property) within that census tract. I need to join or match the two datasets so I end up with a map of every property that has ever had a fire and a list of the properties without ever having a fire. I thought it might be similar nearest neighbor or involve R-trees. However, every time I look for a way of doing this I run into methods of "matching point within the same dataset" not what I need. I have to use two different datasets.

What exactly is this type of matching or joining between nearest lat/long of different datasets called in GIS terminology?

To help answer this question let me show two different dataset with slightly different situations: (It took me a minute of searching to find these polygons) First is the my actual GA data. This data is only of 3 months:

[![Dekalb GA County Fires][1]][1]Dekalb GA County Fires
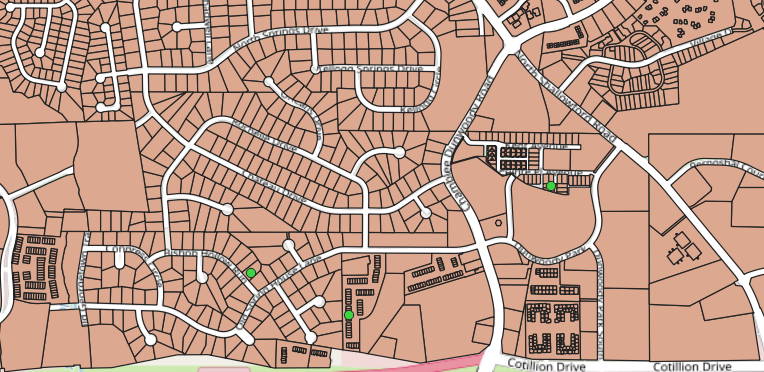
In it, every green point is a building fire, while every brown shape is a building. About 95%-98% of the data overlays a parcel, so I think is a point in polygon overlay.
[1]: https://i.sstatic.net/S2tii.png

I need some terminology help as I am still learning GIS.

I have two datasets. One with the address of every fire and it's latitude/longitude of small census tract. One with the location of every parcel of land (property) within that census tract. I need to join or match the two datasets so I end up with a map of every property that has ever had a fire and a list of the properties without ever having a fire. I thought it might be similar nearest neighbor or involve R-trees. However, every time I look for a way of doing this I run into methods of "matching point within the same dataset" not what I need. I have to use two different datasets.

What exactly is this type of matching or joining between nearest lat/long of different datasets called in GIS terminology?

To help answer this question let me show two different dataset with slightly different situations: (It took me a minute of searching to find these polygons) First is the my actual GA data. This data is only of 3 months:

[![Dekalb GA County Fires][1]][1]

In it, every green point is a building fire, while every brown shape is a building. About 95%-98% of the data overlays a parcel, so I think is a point in polygon overlay.
[1]: https://i.sstatic.net/S2tii.png

I need some terminology help as I am still learning GIS.

I have two datasets. One with the address of every fire and it's latitude/longitude of small census tract. One with the location of every parcel of land (property) within that census tract. I need to join or match the two datasets so I end up with a map of every property that has ever had a fire and a list of the properties without ever having a fire. I thought it might be similar nearest neighbor or involve R-trees. However, every time I look for a way of doing this I run into methods of "matching point within the same dataset" not what I need. I have to use two different datasets.

What exactly is this type of matching or joining between nearest lat/long of different datasets called in GIS terminology?

To help answer this question let me show two different dataset with slightly different situations: (It took me a minute of searching to find these polygons) First is the my actual GA data. This data is only of 3 months:

Dekalb GA County Fires

In it, every green point is a building fire, while every brown shape is a building. About 95%-98% of the data overlays a parcel, so I think is a point in polygon overlay.

deleted 219 characters in body
Source Link
PolyGeo
  • 65.4k
  • 29
  • 114
  • 345

I need some terminology help as I am still learning GIS. Upon request I have split this into two questions.

I have two datasets. One with the address of every fire and it's latitude/longitude of small census tract. One with the location of every parcel of land (property) within that census tract. I need to join or match the two datasets so I end up with a map of every property that has ever had a fire and a list of the properties without ever having a fire. I thought it might be similar nearest neighbor or involve R-trees. However, every time I look for a way of doing this I run into methods of "matching point within the same dataset" not what I need. I have to use two different datasets.

What exactly is this type of matching or joining between nearest lat/long of different datasets called in GIS terminology?

To help answer this question let me show two different dataset with slightly different situations: (It took me a minute of searching to find these polygons) First is the my actual GA data (which seems to fit the answer PolyGeo gave first). Please note thisThis data is only of 3 months: [

[![Dekalb GA County Fires][1]][1]

In it, every green point is a building fire, while every brown shape is a building. (Edit: About About 95%-98% of the data overlays a parcel, so I think it fits theis a point in polygon overlay that Poly was talking about. I have split this off into a second question to deal with the other case. 
[1]: https://i.sstatic.net/S2tii.png

I need some terminology help as I am still learning GIS. Upon request I have split this into two questions.

I have two datasets. One with the address of every fire and it's latitude/longitude of small census tract. One with the location of every parcel of land (property) within that census tract. I need to join or match the two datasets so I end up with a map of every property that has ever had a fire and a list of the properties without ever having a fire. I thought it might be similar nearest neighbor or involve R-trees. However, every time I look for a way of doing this I run into methods of "matching point within the same dataset" not what I need. I have to use two different datasets.

What exactly is this type of matching or joining between nearest lat/long of different datasets called in GIS terminology?

To help answer this question let me show two different dataset with slightly different situations: (It took me a minute of searching to find these polygons) First is the my actual GA data (which seems to fit the answer PolyGeo gave first). Please note this data is only of 3 months: [![Dekalb GA County Fires][1]][1]

In it, every green point is a building fire, while every brown shape is a building. (Edit: About 95%-98% of the data overlays a parcel, so I think it fits the polygon overlay that Poly was talking about. I have split this off into a second question to deal with the other case. [1]: https://i.sstatic.net/S2tii.png

I need some terminology help as I am still learning GIS.

I have two datasets. One with the address of every fire and it's latitude/longitude of small census tract. One with the location of every parcel of land (property) within that census tract. I need to join or match the two datasets so I end up with a map of every property that has ever had a fire and a list of the properties without ever having a fire. I thought it might be similar nearest neighbor or involve R-trees. However, every time I look for a way of doing this I run into methods of "matching point within the same dataset" not what I need. I have to use two different datasets.

What exactly is this type of matching or joining between nearest lat/long of different datasets called in GIS terminology?

To help answer this question let me show two different dataset with slightly different situations: (It took me a minute of searching to find these polygons) First is the my actual GA data. This data is only of 3 months:

[![Dekalb GA County Fires][1]][1]

In it, every green point is a building fire, while every brown shape is a building. About 95%-98% of the data overlays a parcel, so I think is a point in polygon overlay. 
[1]: https://i.sstatic.net/S2tii.png

fixed based on request
Source Link
mlane
  • 160
  • 6

What is getting nearest points between two different but overlaping datasets called?

I need some terminology help as I am still learning GIS. Upon request I have split this into two questions.

I have two datasets. One with the address of every fire and it's latitude/longitude of small census tract. One with the location of every parcel of land (property) within that census tract. I need to join or match the two datasets so I end up with a map of every property that has ever had a fire and a list of the properties without ever having a fire. I thought it might be similar nearest neighbor or involve R-trees. However, every time I look for a way of doing this I run into methods of "matching point within the same dataset" not what I need. I have to use two different datasets.

What exactly is this type of matching or joining between nearest lat/long of different datasets called in GIS terminology?

To help answer this question let me show two different dataset with slightly different situations: (It took me a minute of searching to find these polygons) First is the my actual GA data (which seems to fit the answer PolyGeo gave first). Please note this data is only of 3 months: [![Dekalb GA County Fires][1]][1]

In it, every green point is a building fire, while every brown shape is a building. About 98% (Edit: About 95%-98% of the data overlays a parcel, so I think it fits the polygon overlay that Poly was talking about.

Second, is the original practice data from the City of Pittsburg that is over an 8 year period: [![Pittsburg PA Fires][2]][2]

In it, every red point is a building fire, while every brown point is a building. Each green point is the centriod of a relevant building. To clarify the green points are the centers of the brown regions (ie. I checked), its just that the green ones are of actual places people live). So every fire building data point (red) don't exactly match up to the exact buildings. The problem is because some of Pittsburg fire data (red) was anonymized and had some data collection issues. From my estimate about 20% of the Pittsburg fire data needs to be joined by the nearest polygon or green center point to it.

My concern is that with my GA fire sample I might I have aboutsplit this off into a similar problem when I receive the rest of the 5-8 year data. So I am trying to figure out howsecond question to deal with that 20% possibilitythe other case. [1]: https://i.sstatic.net/S2tii.png [2]: https://i.sstatic.net/sNXE6.png

What is getting nearest points between two different datasets called?

I need some terminology help as I am still learning GIS.

I have two datasets. One with the address of every fire and it's latitude/longitude of small census tract. One with the location of every parcel of land (property) within that census tract. I need to join or match the two datasets so I end up with a map of every property that has ever had a fire and a list of the properties without ever having a fire. I thought it might be similar nearest neighbor or involve R-trees. However, every time I look for a way of doing this I run into methods of "matching point within the same dataset" not what I need. I have to use two different datasets.

What exactly is this type of matching or joining between nearest lat/long of different datasets called in GIS terminology?

To help answer this question let me show two different dataset with slightly different situations: (It took me a minute of searching to find these polygons) First is the my actual GA data (which seems to fit the answer PolyGeo gave first). Please note this data is only of 3 months: [![Dekalb GA County Fires][1]][1]

In it, every green point is a building fire, while every brown shape is a building. About 98% of the data overlays a parcel, so I think it fits the polygon overlay that Poly was talking about.

Second, is the original practice data from the City of Pittsburg that is over an 8 year period: [![Pittsburg PA Fires][2]][2]

In it, every red point is a building fire, while every brown point is a building. Each green point is the centriod of a relevant building. To clarify the green points are the centers of the brown regions (ie. I checked), its just that the green ones are of actual places people live). So every fire building data point (red) don't exactly match up to the exact buildings. The problem is because some of Pittsburg fire data (red) was anonymized and had some data collection issues. From my estimate about 20% of the Pittsburg fire data needs to be joined by the nearest polygon or green center point to it.

My concern is that with my GA fire sample I might have about a similar problem when I receive the rest of the 5-8 year data. So I am trying to figure out how to deal with that 20% possibility. [1]: https://i.sstatic.net/S2tii.png [2]: https://i.sstatic.net/sNXE6.png

What is getting nearest points between two different but overlaping datasets called?

I need some terminology help as I am still learning GIS. Upon request I have split this into two questions.

I have two datasets. One with the address of every fire and it's latitude/longitude of small census tract. One with the location of every parcel of land (property) within that census tract. I need to join or match the two datasets so I end up with a map of every property that has ever had a fire and a list of the properties without ever having a fire. I thought it might be similar nearest neighbor or involve R-trees. However, every time I look for a way of doing this I run into methods of "matching point within the same dataset" not what I need. I have to use two different datasets.

What exactly is this type of matching or joining between nearest lat/long of different datasets called in GIS terminology?

To help answer this question let me show two different dataset with slightly different situations: (It took me a minute of searching to find these polygons) First is the my actual GA data (which seems to fit the answer PolyGeo gave first). Please note this data is only of 3 months: [![Dekalb GA County Fires][1]][1]

In it, every green point is a building fire, while every brown shape is a building. (Edit: About 95%-98% of the data overlays a parcel, so I think it fits the polygon overlay that Poly was talking about. I have split this off into a second question to deal with the other case. [1]: https://i.sstatic.net/S2tii.png

added pictures
Source Link
mlane
  • 160
  • 6
Loading
edited tags; edited tags
Link
PolyGeo
  • 65.4k
  • 29
  • 114
  • 345
Loading
Reduced scope to prevent being too broad
Source Link
PolyGeo
  • 65.4k
  • 29
  • 114
  • 345
Loading
edited title
Source Link
mlane
  • 160
  • 6
Loading
Source Link
mlane
  • 160
  • 6
Loading