added 214 characters in body
Source Link
Spacedman
  • 66.5k
  • 6
  • 83
  • 121

This looks likeis caused by the plotting function which only plots a bug in rasterize when working on small features on large gridssample of the pixels for speed reasons. You can tweak it.

Here's a reproducible example taken from one feature from your shape: These coordinates are part of one feature in your data:

xy = structure(c(417476.8675, 417468.8832, 417473.037, 417458.7495, 
417352.3868, 417328.5742, 417318.52, 417303.7033, 417293.8735, 
5887737.1296, 5887834.9375, 5887938.579, 5888021.6583, 5888042.825, 
5888022.7166, 5887966.6249, 5887940.1665, 5887907.6158), .Dim = c(9L, 
2L), .Dimnames = list(NULL, c("x", "y")))

and we make a SpatialLines object out of it:

ltest = SpatialLines(list(Lines(list(Line(xy)),ID=1)))

we'll use a raster with a much larger extent:

e = extent(c(xmin=414500,xmax=424500,ymin=5882000,ymax=5890000))

Now try and rasterize over a fine grid on that raster:

r5 <- raster(ncol=4000, nrow=4000, extent(e))
rtest = rasterize(ltest,r5)
plot(ltest)
plot(rtest,add=TRUE)

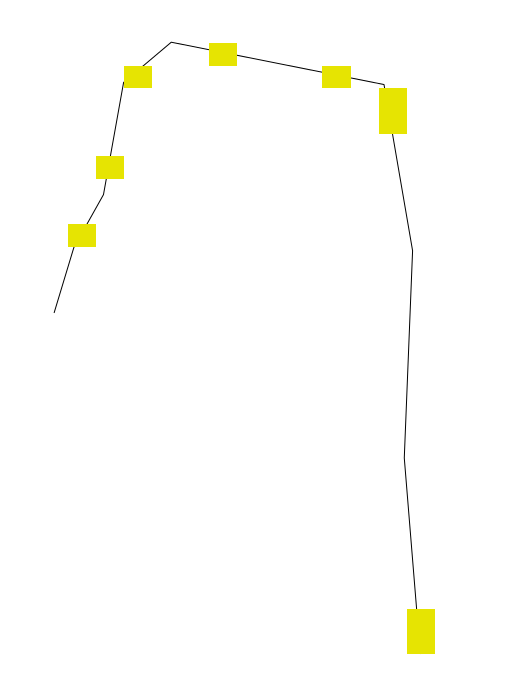
enter image description here

Its clear how bad this isThat only shows a few pixels. However if you restrict the raster to the extent of that one feature and rasterize at the same equivalent approximate resolution it works fineBut. Obviously this isn't practical but it shows there's nothing wrong with the feature to prevent it being rasterized at that cell size..

> sum(rtest[],na.rm=TRUE)
[1] 299

This is givingtells me deja-vu, but I can't find a related bug on the issue tracker so its possible I saw it discussed elsewherethere's 299 pixels.

Have now submitted as Change the https://github.com/rspatial/raster/issues/125maxpixels value to plot and:

> packageVersionplot("raster"ltest)
[1] ‘3.0.12’
> plot(rtest,add=TRUE,maxpixels=ncell(rtest))

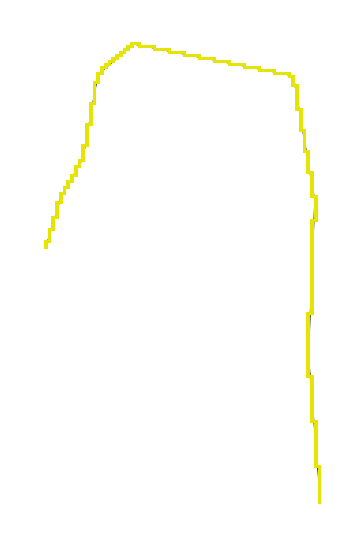
it looks fine:

enter image description here

Note the pixels seem much smaller than in the first plot, because I think when it subsamples them it also rescales them in size so they are visible in a full plot - that makes them way too big in a zoomed plot.

Any analysis you do with this raster will work fine, its only plotting that's affected and then you can fix that with maxpixels. Its not a bug despite what my earlier version may have said!

This looks like a bug in rasterize when working on small features on large grids.

Here's a reproducible example taken from one feature from your shape: These coordinates are part of one feature in your data:

xy = structure(c(417476.8675, 417468.8832, 417473.037, 417458.7495, 
417352.3868, 417328.5742, 417318.52, 417303.7033, 417293.8735, 
5887737.1296, 5887834.9375, 5887938.579, 5888021.6583, 5888042.825, 
5888022.7166, 5887966.6249, 5887940.1665, 5887907.6158), .Dim = c(9L, 
2L), .Dimnames = list(NULL, c("x", "y")))

and we make a SpatialLines object out of it:

ltest = SpatialLines(list(Lines(list(Line(xy)),ID=1)))

we'll use a raster with a much larger extent:

e = extent(c(xmin=414500,xmax=424500,ymin=5882000,ymax=5890000))

Now try and rasterize over a fine grid on that raster:

r5 <- raster(ncol=4000, nrow=4000, extent(e))
rtest = rasterize(ltest,r5)
plot(ltest)
plot(rtest,add=TRUE)

enter image description here

Its clear how bad this is. However if you restrict the raster to the extent of that one feature and rasterize at the same equivalent approximate resolution it works fine. Obviously this isn't practical but it shows there's nothing wrong with the feature to prevent it being rasterized at that cell size.

This is giving me deja-vu, but I can't find a related bug on the issue tracker so its possible I saw it discussed elsewhere.

Have now submitted as https://github.com/rspatial/raster/issues/125

> packageVersion("raster")
[1] ‘3.0.12’
> 

This is caused by the plotting function which only plots a sample of the pixels for speed reasons. You can tweak it.

Here's a reproducible example taken from one feature from your shape: These coordinates are part of one feature in your data:

xy = structure(c(417476.8675, 417468.8832, 417473.037, 417458.7495, 
417352.3868, 417328.5742, 417318.52, 417303.7033, 417293.8735, 
5887737.1296, 5887834.9375, 5887938.579, 5888021.6583, 5888042.825, 
5888022.7166, 5887966.6249, 5887940.1665, 5887907.6158), .Dim = c(9L, 
2L), .Dimnames = list(NULL, c("x", "y")))

and we make a SpatialLines object out of it:

ltest = SpatialLines(list(Lines(list(Line(xy)),ID=1)))

we'll use a raster with a much larger extent:

e = extent(c(xmin=414500,xmax=424500,ymin=5882000,ymax=5890000))

Now try and rasterize over a fine grid on that raster:

r5 <- raster(ncol=4000, nrow=4000, extent(e))
rtest = rasterize(ltest,r5)
plot(ltest)
plot(rtest,add=TRUE)

enter image description here

That only shows a few pixels. But...

> sum(rtest[],na.rm=TRUE)
[1] 299

tells me there's 299 pixels. Change the maxpixels value to plot and:

> plot(ltest)
> plot(rtest,add=TRUE,maxpixels=ncell(rtest))

it looks fine:

enter image description here

Note the pixels seem much smaller than in the first plot, because I think when it subsamples them it also rescales them in size so they are visible in a full plot - that makes them way too big in a zoomed plot.

Any analysis you do with this raster will work fine, its only plotting that's affected and then you can fix that with maxpixels. Its not a bug despite what my earlier version may have said!
Source Link
Spacedman
  • 66.5k
  • 6
  • 83
  • 121

This looks like a bug in rasterize when working on small features on large grids.

Here's a reproducible example taken from one feature from your shape: These coordinates are part of one feature in your data:

xy = structure(c(417476.8675, 417468.8832, 417473.037, 417458.7495, 
417352.3868, 417328.5742, 417318.52, 417303.7033, 417293.8735, 
5887737.1296, 5887834.9375, 5887938.579, 5888021.6583, 5888042.825, 
5888022.7166, 5887966.6249, 5887940.1665, 5887907.6158), .Dim = c(9L, 
2L), .Dimnames = list(NULL, c("x", "y")))

and we make a SpatialLines object out of it:

ltest = SpatialLines(list(Lines(list(Line(xy)),ID=1)))

we'll use a raster with a much larger extent:

e = extent(c(xmin=414500,xmax=424500,ymin=5882000,ymax=5890000))

Now try and rasterize over a fine grid on that raster:

r5 <- raster(ncol=4000, nrow=4000, extent(e))
rtest = rasterize(ltest,r5)
plot(ltest)
plot(rtest,add=TRUE)

enter image description here

Its clear how bad this is. However if you restrict the raster to the extent of that one feature and rasterize at the same equivalent approximate resolution it works fine. Obviously this isn't practical but it shows there's nothing wrong with the feature to prevent it being rasterized at that cell size.

This is giving me deja-vu, but I can't find a related bug on the issue tracker so its possible I saw it discussed elsewhere.

Have now submitted as https://github.com/rspatial/raster/issues/125

> packageVersion("raster")
[1] ‘3.0.12’
>