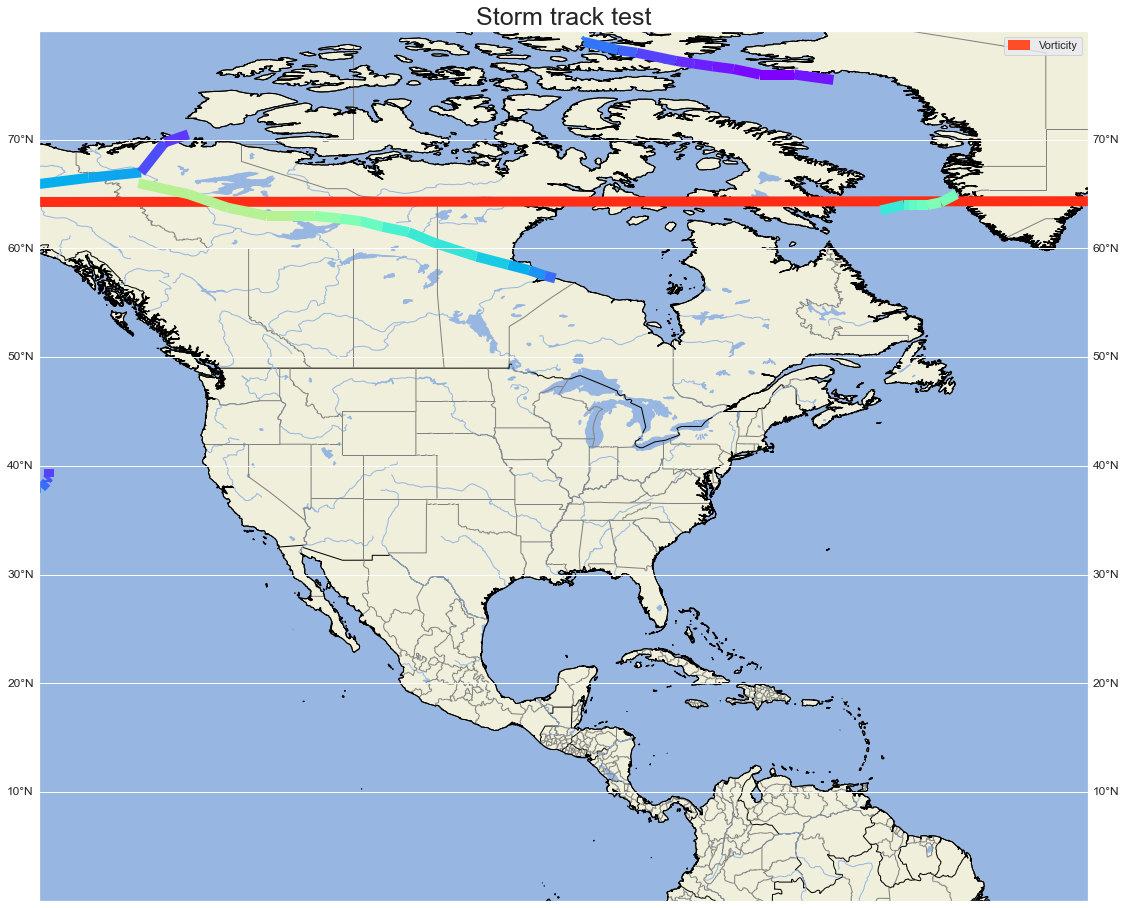
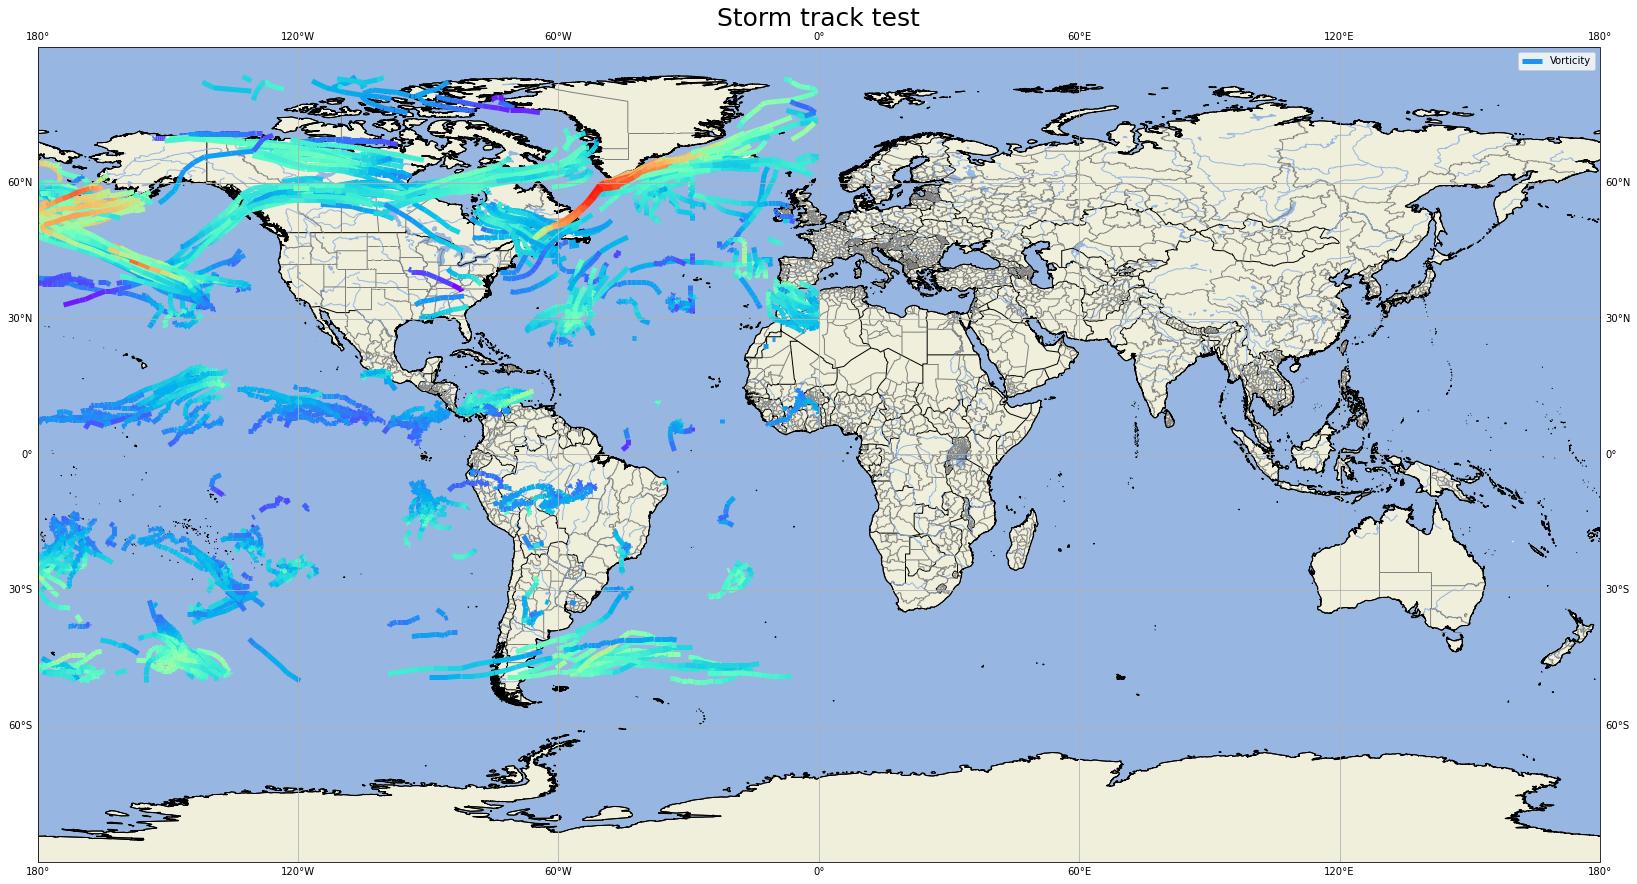
I'm working on a stormtracking project, and I realized that the longitude sign of some values in my GeoPandas dataframe are wrong; i.e. I need negative longitudes instead of positive ones.
When I trace my storm tracks, I have an ugly horizontal line (the red one) which can be explained by a change in the sign of longitude in geometry.linestring.
For example:
My GeoDataFrame looks like:
    DEBUT    MEMBER FIN        ID   VORT    PRES    CIRC           geometry
11  2020112415  0   2020112418  49  78.0    952.88  0.0 LINESTRING (-175 60, -174.75 61.5)
12  2020112418  0   2020112421  49  80.0    950.16  0.0 LINESTRING (-174.75 61.5, -175.25 62.5)
13  2020112421  0   2020112500  49  81.0    948.5   0.0 LINESTRING (-175.25 62.5, -176.5 63.5)
14  2020112500  0   2020112503  49  81.0    946.03  0.0 LINESTRING (-176.5 63.5, -177.75 64)
15  2020112503  0   2020112506  49  79.0    945.21  0.0 LINESTRING (-177.75 64, -179.5 64.25)
16  2020112506  0   2020112509  49  77.0    945.48  0.0 LINESTRING (-179.5 64.25, 178.75 64.5)
Then I'm trying to change the last row with spent many hours on it:
16 2020112506 0 2020112509 49 77.0 945.48 0.0 LINESTRING (-179.5 64.25, 178.75 64.5)
Is there any function in GeoPandas to easily manipulate the coordinates?
I'm turning around ... here's my last attempt to modify longitudes:
def swap2(x):
    coords = list(x.coords)
    coords = [Point(-t[0], t[1]) for t in coords]
    return LineString(coords)

tempete=tempete.geometry.map(swap2)
This is what I tried to do. I had never used geopandas before, now I can see how to handle linesting.
Unfortunately, I was digging in the wrong direction. I think my longitudes are correct. If I change my longitudes by simply applying a sign - on negative values, I naturally lose storms for longitudes above 0deg ... I have to find a solution to correctly visualize storms that go from -180gW to 180degE.
After swap2:


