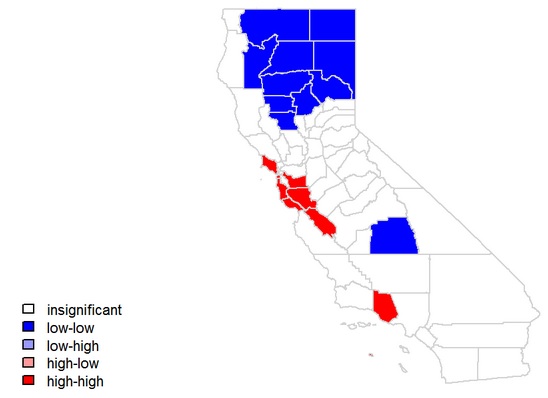
I want to draw the following LISA map using LISA plot:

I have coded as follow:
o1<-California_shp$houseValue
o1
 [1] 208747.39 118700.00 117146.43  89611.54 107893.75  77731.25 216783.78
 [8]  97163.64 145876.67  84680.57  72276.88  89362.60  74405.08 100794.39
[15]  81421.08  76828.41  93896.55  76176.00 237163.15  85700.00 355758.13
[22] 100177.78 120720.00  93139.06  51162.50 152129.41 226799.51 204133.01
[29] 151272.92 254876.92 171049.24  97109.09 140104.60 131881.10 216078.57
[36] 126713.36 194194.35 337972.47 121807.89 212139.69 350042.94 251899.02
[43] 302819.04 255027.12  90765.29  77887.50  68205.41 147259.80 205761.74
[50] 129957.89  95244.64  73006.12  70718.48  78767.05 124328.07 251974.24
[57] 140881.01  78558.49

neigh1<-poly2nb(California_shp,queen=TRUE)
neigh1
Neighbour list object:
Number of regions: 58
Number of nonzero links: 276
Percentage nonzero weights: 8.204518
Average number of links: 4.758621

listw1<-nb2listw(neigh1,style = "B")
listw1
Characteristics of weights list object:
Neighbour list object:
Number of regions: 58
Number of nonzero links: 276
Percentage nonzero weights: 8.204518
Average number of links: 4.758621

Weights style: B
Weights constants summary:
   n   nn  S0  S1   S2
B 58 3364 276 552 5752

moran(o1,listw1,S0=Szero(listw1),n=length(neigh))$I
[1] 0.06761524
local1<-localmoran(o1,listw1)
head(local1)
         Ii       E.Ii   Var.Ii      Z.Ii  Pr(z > 0)
1 4.0597758 -0.0877193 4.466689 1.9624248 0.02485652
2 0.4033954 -0.0877193 4.466689 0.2323754 0.40812323
3 0.5311378 -0.0877193 4.466689 0.2928178 0.38483070
4 3.7039811 -0.1052632 5.261654 1.6606483 0.04839205
5 0.7905368 -0.0877193 4.466689 0.4155548 0.33886790
6 2.7982894 -0.0877193 4.466689 1.3655411 0.08604152
I want to use the following method:
source(LISA.R)
LISA.plot(y=California_shp$houseValue,sp=California_shp,local1)
But I do not know how to find LISA.R. The output message in R is:
source(LISA.R)
Error in source(LISA.R) : object 'LISA.R' not found
So how can I find the data of LISA.R?