deleted 243 characters in body
Source Link
Ben
  • 203
  • 3
  • 9

I am going to put this as an answer because I'll post some code.

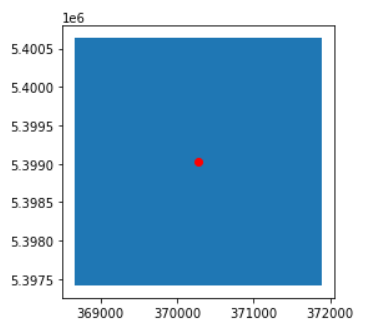
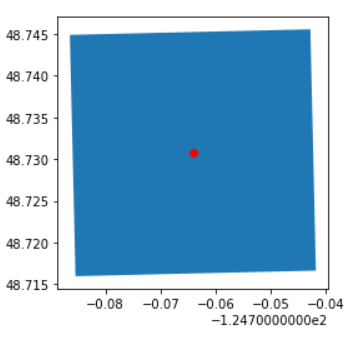
@blacksite (in the comments): It may be easier to work in a metric crs. Consider this, where I convert your point to UTM zone 10N (EPSG:32610), to get a metric projection, then create a circular buffer and take its bounding box:

import geopandas as gpd
from shapely.geometry import Point, box

p = Point((-124.76410018717496, 48.7307614817832))  # lon, lat
pp = gpd.GeoSeries(p).set_crs(4326).to_crs(32610)[0] # Convert to UTM for plot)

gs = gpd.GeoSeries(p).set_crs(4326).to_crs(32610).buffer(1609,34) # 1 mile circular buffer

gs_plot = gpd.GeoSeries([pp,box(*gs.bounds.values[0])]).set_crs(32610) # For plotting

# Plot
ax = gs_plot[1:].plot()
gs_plot[:1].plot(ax=ax, color="red")

enter image description here

ax = gs_plot.to_crs(4326)[1:].plot()
gs_plot[:1].to_crs(4326).plot(ax=ax, color="red")

enter image description here

I think, this is much easier. The only "difficult" part now would be to check for each of your points, in which UTM zone they lie in. This and this may help, but I'm pretty sure that there's a very nice way to find out by the lat/lon coordinates in which zone they are in.

I hope this helps. I am not entirely sure whether this is what you are looking for.
I am going to put this as an answer because I'll post some code.

@blacksite (in the comments): It may be easier to work in a metric crs. Consider this, where I convert your point to UTM zone 10N (EPSG:32610), to get a metric projection, then create a circular buffer and take its bounding box:

import geopandas as gpd
from shapely.geometry import Point, box

p = Point((-124.76410018717496, 48.7307614817832))  # lon, lat
pp = gpd.GeoSeries(p).set_crs(4326).to_crs(32610)[0] # Convert to UTM for plot)

gs = gpd.GeoSeries(p).set_crs(4326).to_crs(32610).buffer(1609,34) # 1 mile circular buffer

gs_plot = gpd.GeoSeries([pp,box(*gs.bounds.values[0])]).set_crs(32610) # For plotting

# Plot
ax = gs_plot[1:].plot()
gs_plot[:1].plot(ax=ax, color="red")

enter image description here

ax = gs_plot.to_crs(4326)[1:].plot()
gs_plot[:1].to_crs(4326).plot(ax=ax, color="red")

enter image description here

I think, this is much easier. The only "difficult" part now would be to check for each of your points, in which UTM zone they lie in, but I'm pretty sure that there's a very nice way to find out by the lat/lon coordinates.

I hope this helps. I am not entirely sure whether this is what you are looking for.
Source Link
Ben
  • 203
  • 3
  • 9

I am going to put this as an answer because I'll post some code.

@blacksite (in the comments): It may be easier to work in a metric crs. Consider this, where I convert your point to UTM zone 10N (EPSG:32610), to get a metric projection, then create a circular buffer and take its bounding box:

import geopandas as gpd
from shapely.geometry import Point, box

p = Point((-124.76410018717496, 48.7307614817832))  # lon, lat
pp = gpd.GeoSeries(p).set_crs(4326).to_crs(32610)[0] # Convert to UTM for plot)

gs = gpd.GeoSeries(p).set_crs(4326).to_crs(32610).buffer(1609,34) # 1 mile circular buffer

gs_plot = gpd.GeoSeries([pp,box(*gs.bounds.values[0])]).set_crs(32610) # For plotting

# Plot
ax = gs_plot[1:].plot()
gs_plot[:1].plot(ax=ax, color="red")

enter image description here

ax = gs_plot.to_crs(4326)[1:].plot()
gs_plot[:1].to_crs(4326).plot(ax=ax, color="red")

enter image description here

I think, this is much easier. The only "difficult" part now would be to check for each of your points, in which UTM zone they lie in. This and this may help, but I'm pretty sure that there's a very nice way to find out by the lat/lon coordinates in which zone they are in.

I hope this helps. I am not entirely sure whether this is what you are looking for.