refined code
Source Link
Jeffrey Evans
  • 32k
  • 2
  • 48
  • 97

Now that we have indicated all of the issues you could try some clustering approaches using optimizations such as Simulated Annealing. Here is a quick worked example using Max-p Simulated Annealing. The use of queen_weights is defining first order neighbors (those that touch) and the optimization target is 10% of the population which would be similar to your "sum to 1 target". Keep in mind that this clustering approach uses simulated annealing so, changes in the heating parameter can result in very different solutions.

library(sf)
library(rgeoda)

guerry <- st_read(system.file("extdata", "Guerry.shp", 
                  package = "rgeoda"))
  dguerry <- guerry[c('Crm_prs','Crm_prp','Litercy','Donatns','Infants','Suicids''Pop1831')]
   
ijw <- queen_weights(guerry)
 
bound_variable <- guerry['Pop1831']
min_boundmpc <- maxp_sa(ijw, guerry, guerry['Pop1831'], 3236.67, # 
 10% of Pop1831

mpc <- maxp_sa(ijw, d, bound_variable, min_bound,         cooling_rate=0.85, sa_maxit=1)
    guerry$clust <- mpc$Clusters
      plot(guerry["clust"])

Here we check the solution(s)

for(i in sort(unique(guerry$clust))) {
  cat("sum of cluster", i, sum(guerry[guerry$clust == i,]$Pop1831),
      "with target of 3236.67",  "\n")
}   

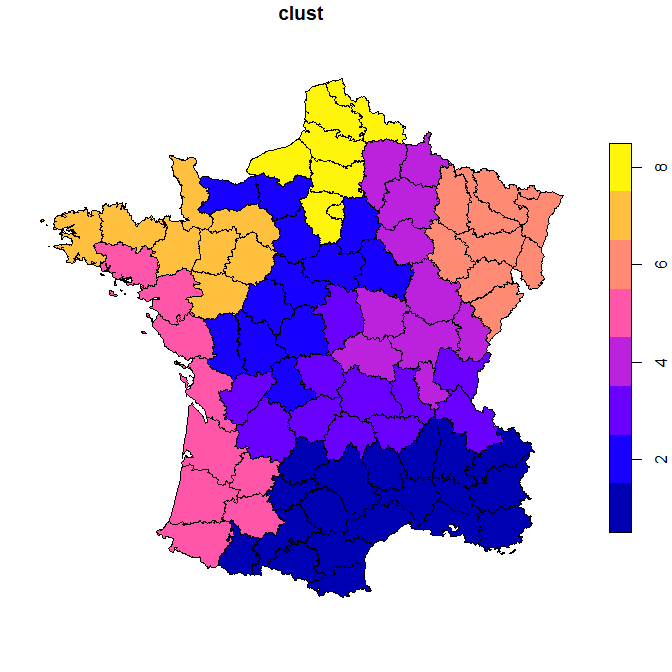
example cluster solution

Now, lets look at your data (p sf polygon object was created from the structure output in the original post).

ijw <- queen_weights(p)
bound_variable <- p["lprd_offtk"]
min_bound <- 1
mpc <- maxp_sa(ijw, p, bound_variablep["lprd_offtk"], min_bound1, 
                 cooling_rate=0.85, sa_maxit=1)
    p$clust <- mpc$Clusters
      plot(p["clust"])

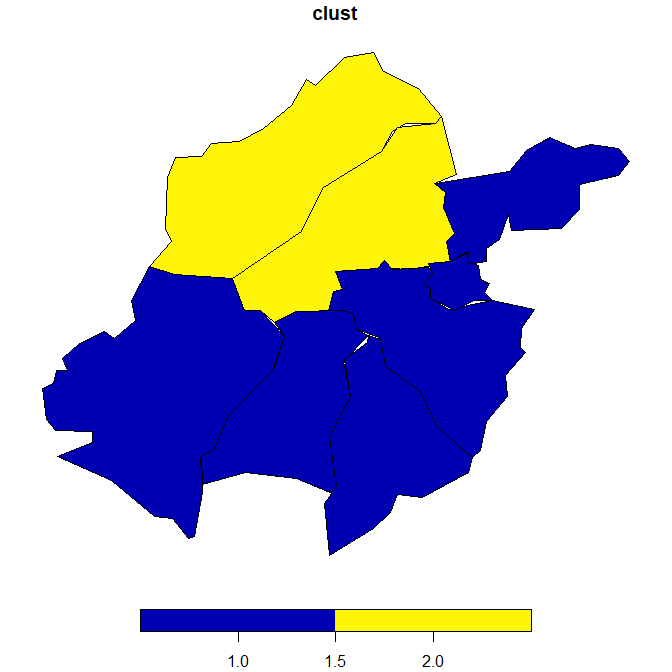
Here we can check how close to target sum we get (in my run it was 2 cluster solutions with 1.261058 and 1.047192).

sumfor(p[p$clusti ==in 1,]$lprd_offtksort(unique(p$clust))) {
  cat("sum of cluster", i, sum(p[p$clust == 2i,]$lprd_offtk),
      "with target of 1",  "\n")
}

your data cluster solution

Now that we have indicated all of the issues you could try some clustering approaches using optimizations such as Simulated Annealing. Here is a quick worked example using Max-p Simulated Annealing. The use of queen_weights is defining first order neighbors (those that touch) and the optimization target is 10% of the population which would be similar to your "sum to 1 target". Keep in mind that this clustering approach uses simulated annealing so, changes in the heating parameter can result in very different solutions.

library(sf)
library(rgeoda)

guerry <- st_read(system.file("extdata", "Guerry.shp", package = "rgeoda"))
  d <- guerry[c('Crm_prs','Crm_prp','Litercy','Donatns','Infants','Suicids')]
  ijw <- queen_weights(guerry)
 
bound_variable <- guerry['Pop1831']
min_bound <- 3236.67 # 10% of Pop1831

mpc <- maxp_sa(ijw, d, bound_variable, min_bound, cooling_rate=0.85, sa_maxit=1)
  guerry$clust <- mpc$Clusters
    plot(guerry["clust"])

Now, lets look at your data (p sf polygon object was created from the structure output in the original post).

ijw <- queen_weights(p)
bound_variable <- p["lprd_offtk"]
min_bound <- 1
mpc <- maxp_sa(ijw, p, bound_variable, min_bound, 
               cooling_rate=0.85, sa_maxit=1)
  p$clust <- mpc$Clusters
    plot(p["clust"])

Here we can check how close to target sum we get (in my run it was 2 cluster solutions with 1.261058 and 1.047192).

sum(p[p$clust == 1,]$lprd_offtk)
sum(p[p$clust == 2,]$lprd_offtk)

Now that we have indicated all of the issues you could try some clustering approaches using optimizations such as Simulated Annealing. Here is a quick worked example using Max-p Simulated Annealing. The use of queen_weights is defining first order neighbors (those that touch) and the optimization target is 10% of the population which would be similar to your "sum to 1 target". Keep in mind that this clustering approach uses simulated annealing so, changes in the heating parameter can result in very different solutions.

library(sf)
library(rgeoda)

guerry <- st_read(system.file("extdata", "Guerry.shp", 
                  package = "rgeoda"))
  guerry <- guerry[c('Crm_prs','Crm_prp','Pop1831')]
 
ijw <- queen_weights(guerry)
  mpc <- maxp_sa(ijw, guerry, guerry['Pop1831'], 3236.67,  
                 cooling_rate=0.85, sa_maxit=1)
    guerry$clust <- mpc$Clusters
      plot(guerry["clust"])

Here we check the solution(s)

for(i in sort(unique(guerry$clust))) {
  cat("sum of cluster", i, sum(guerry[guerry$clust == i,]$Pop1831),
      "with target of 3236.67",  "\n")
}   

example cluster solution

Now, lets look at your data (p sf polygon object was created from the structure output in the original post).

ijw <- queen_weights(p)
  mpc <- maxp_sa(ijw, p, p["lprd_offtk"], 1, 
                 cooling_rate=0.85, sa_maxit=1)
    p$clust <- mpc$Clusters
      plot(p["clust"])

Here we can check how close to target sum we get (in my run it was 2 cluster solutions with 1.261058 and 1.047192).

for(i in sort(unique(p$clust))) {
  cat("sum of cluster", i, sum(p[p$clust == i,]$lprd_offtk),
      "with target of 1",  "\n")
}
your data cluster solution

added 280 characters in body
Source Link
Jeffrey Evans
  • 32k
  • 2
  • 48
  • 97

Now that we have indicated all of the issues you could try some clustering approaches using optimizations such as Simulated Annealing. Here is a quick worked example using Max-p Simulated Annealing. The use of queen_weights is defining first order neighbors (those that touch) and the optimization target is 10% of the population which would be similar to your "sum to 1 target". Keep in mind that this clustering approach uses simulated annealing so, changes in the heating parameter can result in very different solutions.

library(sf)
library(rgeoda)

guerry <- st_read(system.file("extdata", "Guerry.shp", package = "rgeoda"))
  d <- guerry[c('Crm_prs','Crm_prp','Litercy','Donatns','Infants','Suicids')]
  ijw <- queen_weights(guerry)

bound_variable <- guerry['Pop1831']
min_bound <- 3236.67 # 10% of Pop1831

mpc <- maxp_sa(ijw, d, bound_variable, min_bound, cooling_rate=0.85, sa_maxit=1)
  guerry$clust <- mpc$Clusters
    plot(guerry["clust"])

Now, lets look at your data (p sf polygon object was created from the structure output in the original post).

ijw <- queen_weights(p)
bound_variable <- p["lprd_offtk"]
min_bound <- 1
mpc <- maxp_sa(ijw, p, bound_variable, min_bound, 
               cooling_rate=0.85, sa_maxit=1)
  p$clust <- mpc$Clusters
    plot(p["clust"])

Here we can check how close to target sum we get (in my run it was 2 cluster solutions with 1.261058 and 1.047192).

sum(p[p$clust == 1,]$lprd_offtk)
sum(p[p$clust == 2,]$lprd_offtk)

Now that we have indicated all of the issues you could try some clustering approaches using optimizations such as Simulated Annealing. Here is a quick worked example using Max-p Simulated Annealing. The use of queen_weights is defining first order neighbors (those that touch) and the optimization target is 10% of the population which would be similar to your "sum to 1 target". Keep in mind that this clustering approach uses simulated annealing so, changes in the heating parameter can result in very different solutions.

library(sf)
library(rgeoda)

guerry <- st_read(system.file("extdata", "Guerry.shp", package = "rgeoda"))
  d <- guerry[c('Crm_prs','Crm_prp','Litercy','Donatns','Infants','Suicids')]
  ijw <- queen_weights(guerry)

bound_variable <- guerry['Pop1831']
min_bound <- 3236.67 # 10% of Pop1831

mpc <- maxp_sa(ijw, d, bound_variable, min_bound, cooling_rate=0.85, sa_maxit=1)
  guerry$clust <- mpc$Clusters
    plot(guerry["clust"])

Now, lets look at your data (p sf polygon object was created from the structure output in the original post).

ijw <- queen_weights(p)
bound_variable <- p["lprd_offtk"]
min_bound <- 1
mpc <- maxp_sa(ijw, p, bound_variable, min_bound, 
               cooling_rate=0.85, sa_maxit=1)
  p$clust <- mpc$Clusters
    plot(p["clust"])

Here we can check how close to target sum we get (in my run it was 2 cluster solutions with 1.261058 and 1.047192).

sum(p[p$clust == 1,]$lprd_offtk)
sum(p[p$clust == 2,]$lprd_offtk)
added 280 characters in body
Source Link
Jeffrey Evans
  • 32k
  • 2
  • 48
  • 97

Now that we have indicated all of the issues you could try some clustering approaches using optimizations such as Simulated Annealing. Here is a quick worked example using Max-p Simulated Annealing. The use of queen_weights is defining first order neighbors (those that touch) and the optimization target is 10% of the population which would be similar to your "sum to 1 target". Keep in mind that this clustering approach uses simulated annealing so, changes in the heating parameter can result in very different solutions.

library(sf)
library(rgeoda)

guerry <- st_read(system.file("extdata", "Guerry.shp", package = "rgeoda"))
  d <- guerry[c('Crm_prs','Crm_prp','Litercy','Donatns','Infants','Suicids')]
  ijw <- queen_weights(guerry)

bound_variable <- guerry['Pop1831']
min_bound <- 3236.67 # 10% of Pop1831

mpc <- maxp_sa(ijw, d, bound_variable, min_bound, cooling_rate=0.85, sa_maxit=1)
  guerry$clust <- mpc$Clusters
    plot(guerry["clust"])

Now that we have indicated all of the issues you could try some clustering approaches using optimizations such as Simulated Annealing. Here is a quick worked example using Max-p Simulated Annealing. The optimization target is 10% of the population.

library(sf)
library(rgeoda)

guerry <- st_read(system.file("extdata", "Guerry.shp", package = "rgeoda"))
  d <- guerry[c('Crm_prs','Crm_prp','Litercy','Donatns','Infants','Suicids')]
  ijw <- queen_weights(guerry)

bound_variable <- guerry['Pop1831']
min_bound <- 3236.67 # 10% of Pop1831

mpc <- maxp_sa(ijw, d, bound_variable, min_bound, cooling_rate=0.85, sa_maxit=1)
  guerry$clust <- mpc$Clusters
    plot(guerry["clust"])

Now that we have indicated all of the issues you could try some clustering approaches using optimizations such as Simulated Annealing. Here is a quick worked example using Max-p Simulated Annealing. The use of queen_weights is defining first order neighbors (those that touch) and the optimization target is 10% of the population which would be similar to your "sum to 1 target". Keep in mind that this clustering approach uses simulated annealing so, changes in the heating parameter can result in very different solutions.

library(sf)
library(rgeoda)

guerry <- st_read(system.file("extdata", "Guerry.shp", package = "rgeoda"))
  d <- guerry[c('Crm_prs','Crm_prp','Litercy','Donatns','Infants','Suicids')]
  ijw <- queen_weights(guerry)

bound_variable <- guerry['Pop1831']
min_bound <- 3236.67 # 10% of Pop1831

mpc <- maxp_sa(ijw, d, bound_variable, min_bound, cooling_rate=0.85, sa_maxit=1)
  guerry$clust <- mpc$Clusters
    plot(guerry["clust"])
Source Link
Jeffrey Evans
  • 32k
  • 2
  • 48
  • 97
Loading