added 37 characters in body
Source Link
Babel
  • 75k
  • 15
  • 87
  • 227

Thanks to the link postedlink posted by @Babel I was able to solve the problem @Babel, I was able to solve the problem. Example for the green color:

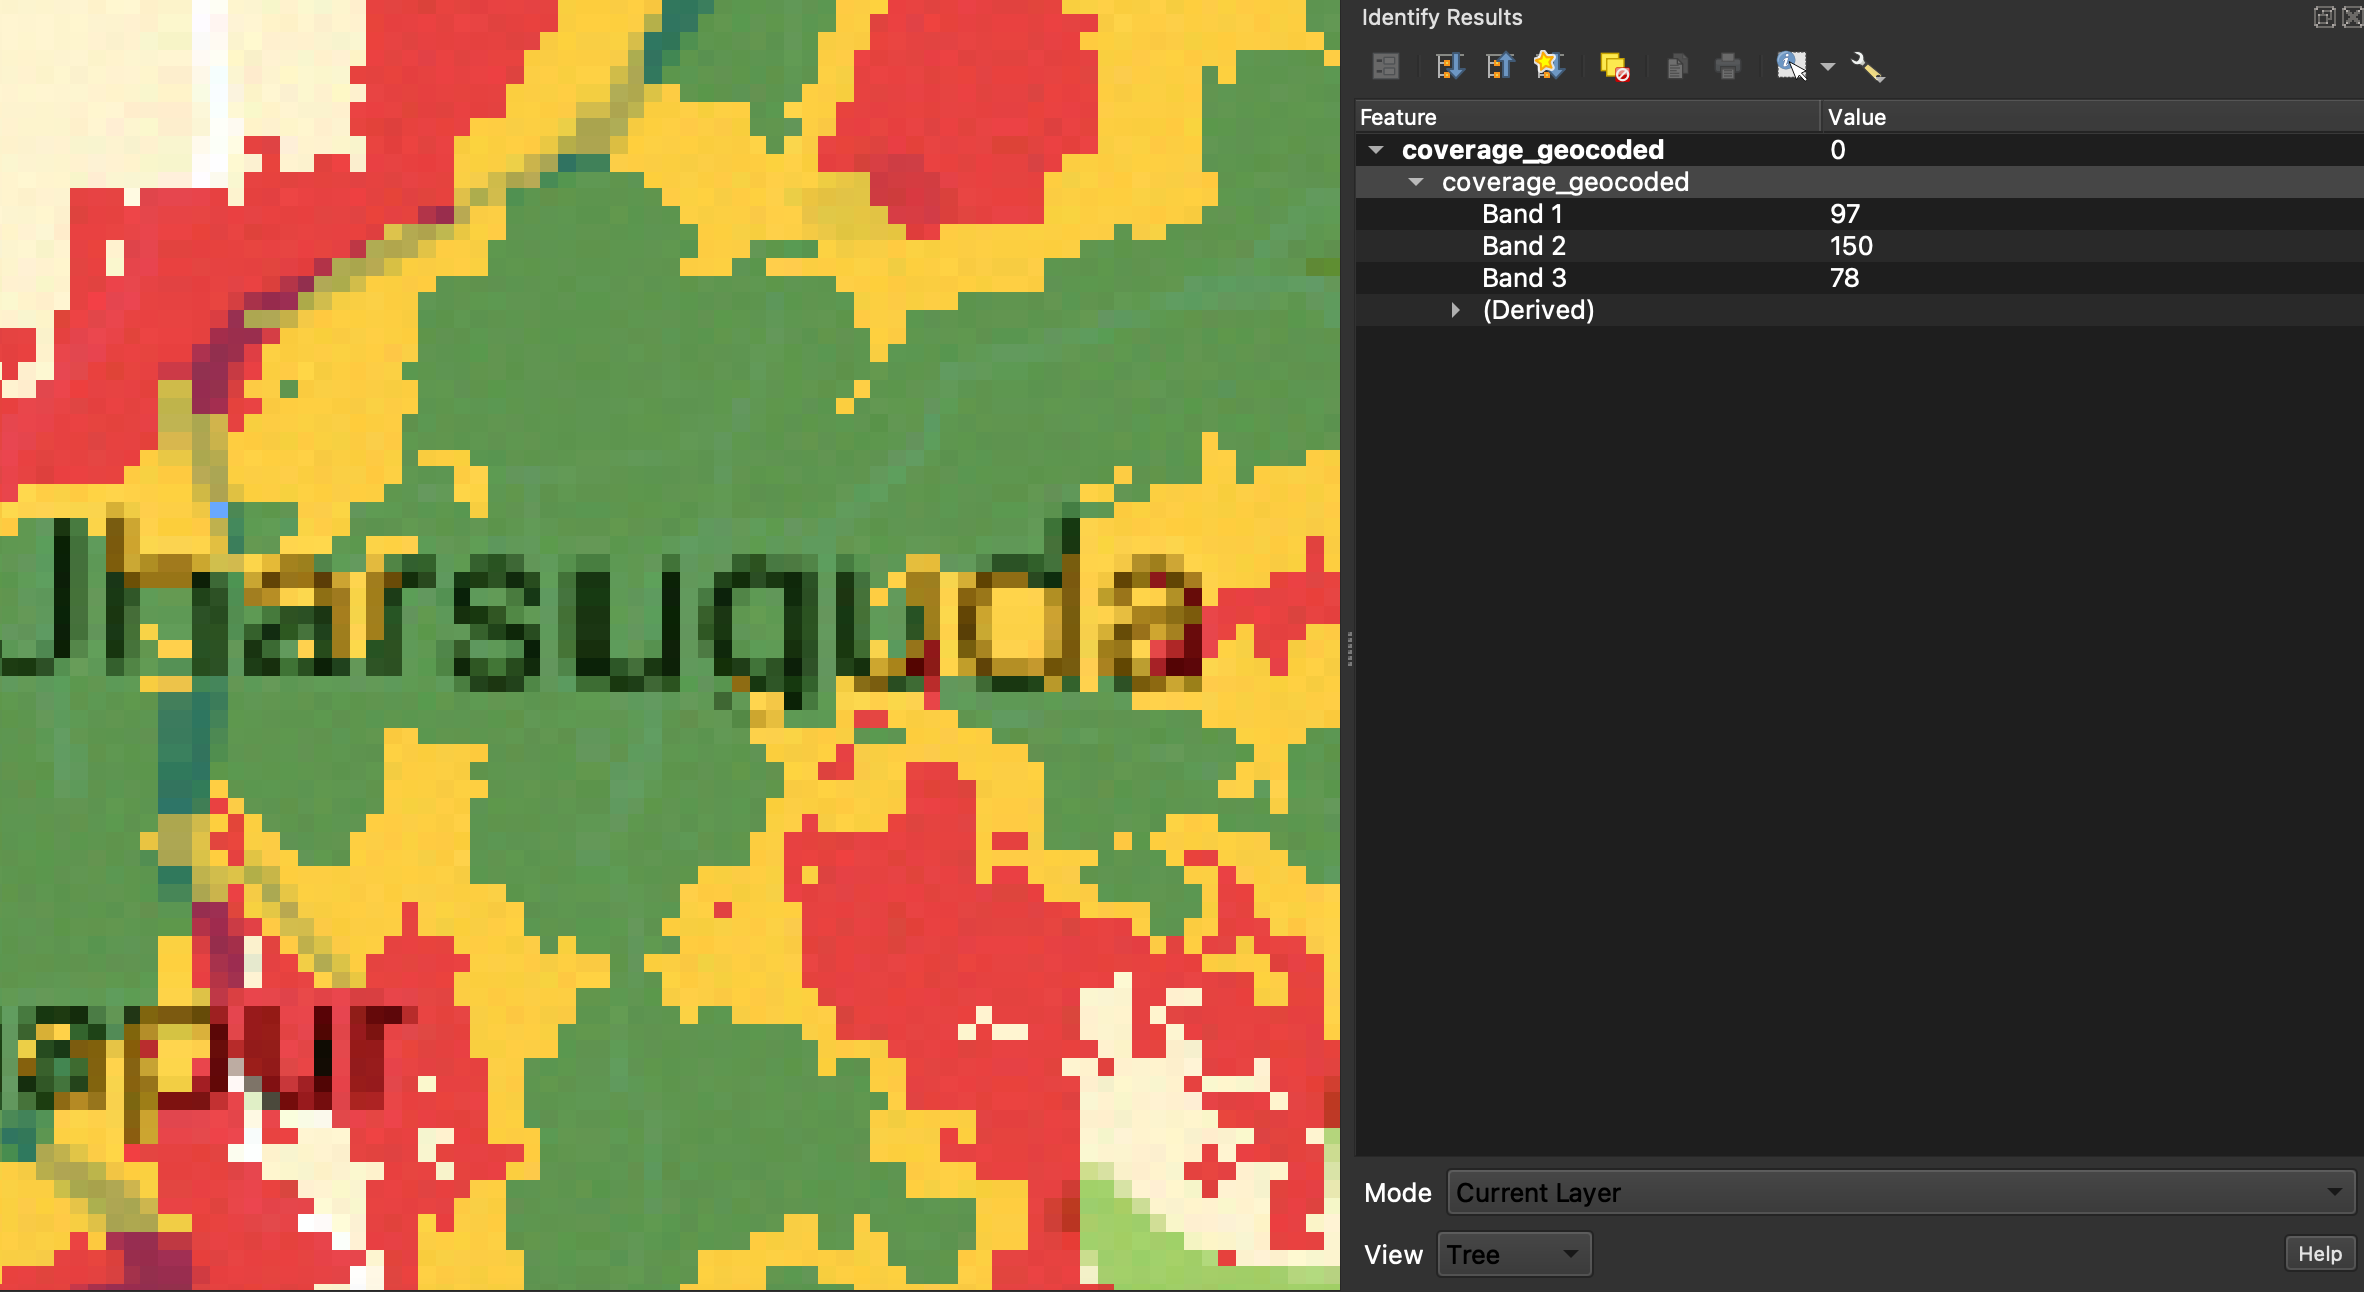
  1. Use "Identify Features" "Identify Features" button on the input image and click on a number of green areas of the map.

  2. While doing so, note the entries in "Band1", "Band2", "Band3". Identify the maximum and minimum values for the respective color after collecting this data for a number of points. enter image description here
  3. Then open the "raster calculator" processing algorithm in QGIS enter image description here

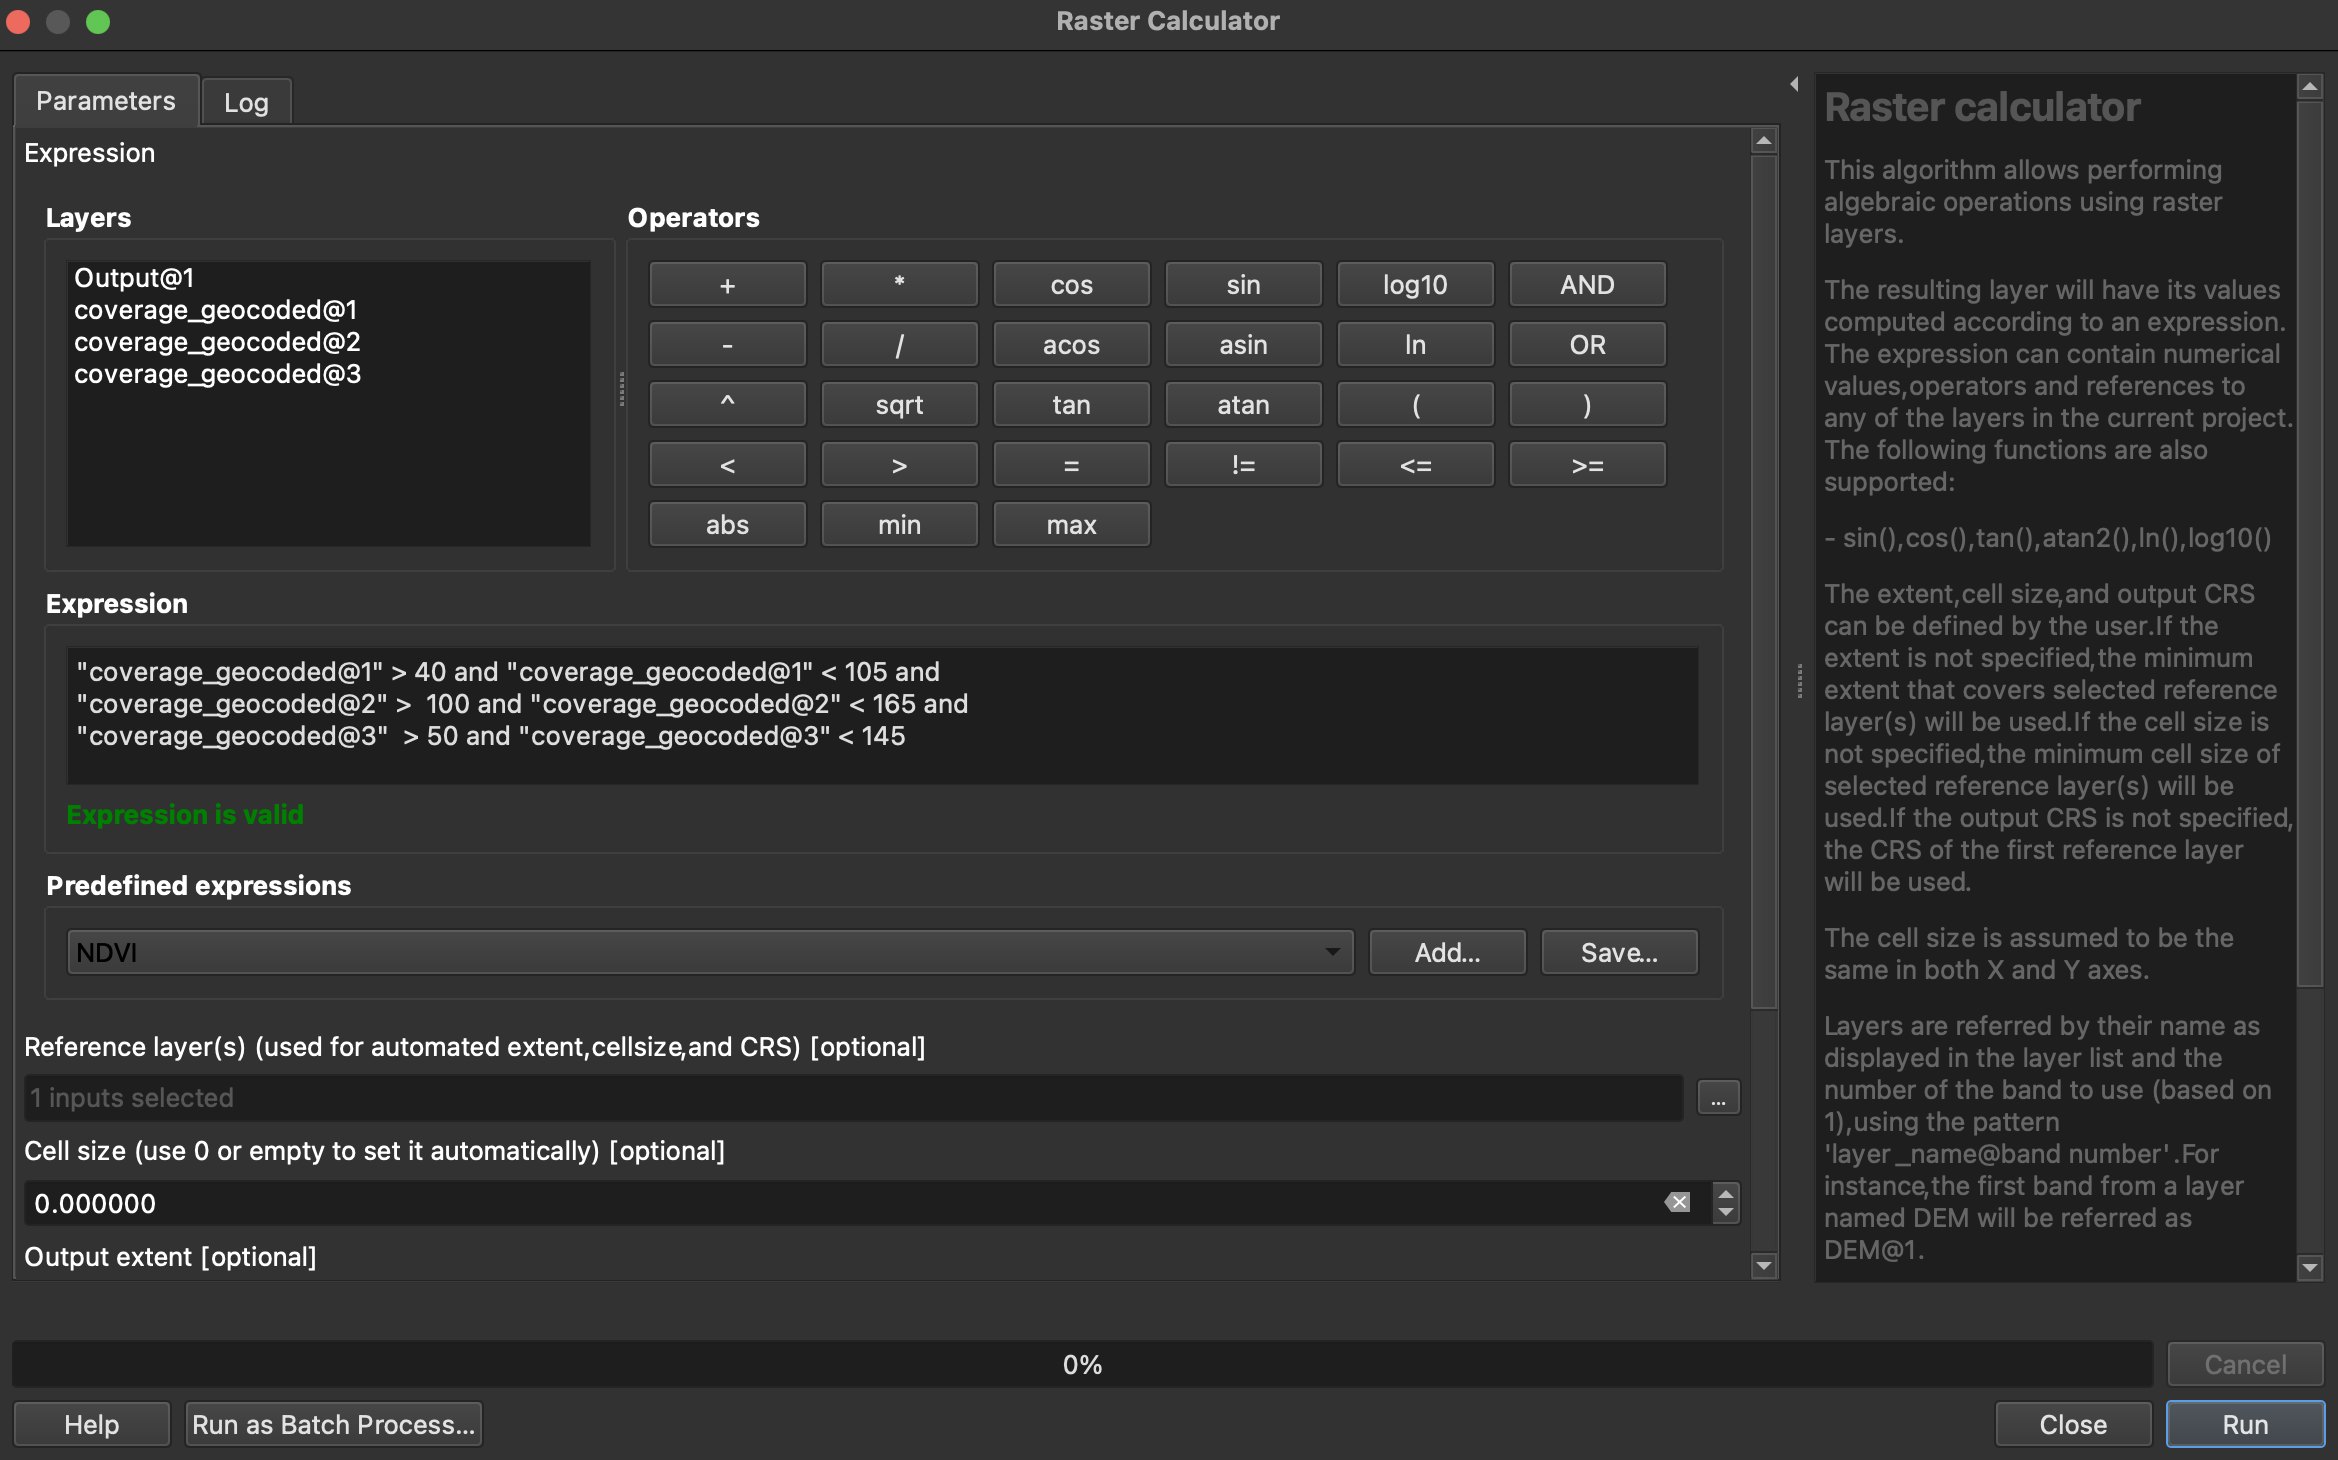
  4. Use the following code to set the min and max for each band. Note that in my case the bands are called "coverage_geocoded". Further, the input layer / reference layer needs to be chosen.

"coverage_geocoded@1" > 40 and "coverage_geocoded@1" < 105 and

"coverage_geocoded@2" > 100 and "coverage_geocoded@2" < 165 and

"coverage_geocoded@3" > 50 and "coverage_geocoded@3" < 145

   "coverage_geocoded@1" > 40 and "coverage_geocoded@1" < 105 and 
   "coverage_geocoded@2" >  100 and "coverage_geocoded@2" < 165 and
   "coverage_geocoded@3"  > 50 and "coverage_geocoded@3" < 145

enter image description here

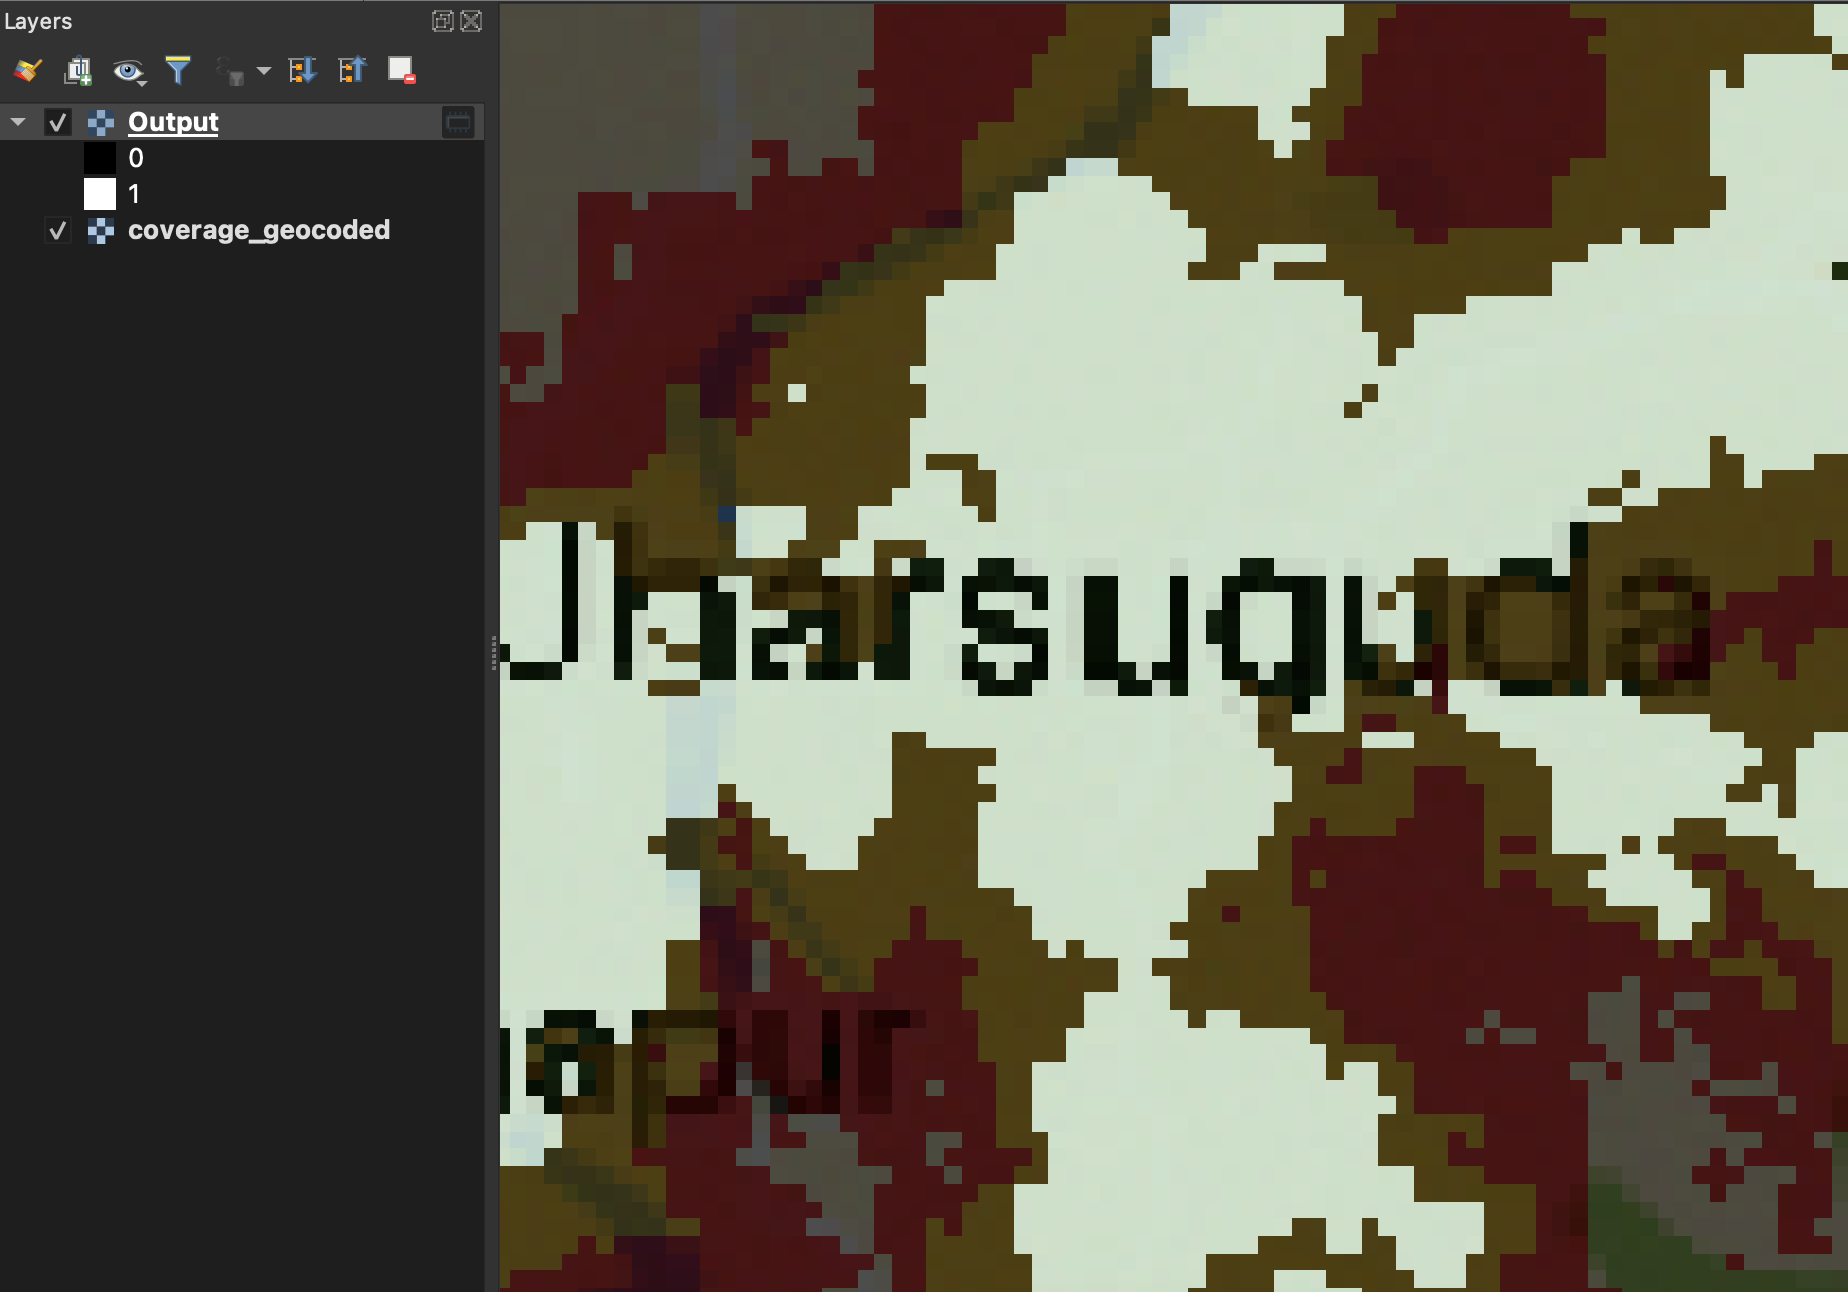
  1. Run algorithm. This creates a new layer with value equal to 1 if the respective section of the image is green:

enter image description here

Note: To find the "correct" min and max values I had to run the algorithm multiple times, while adjusting the values for points that were not correctly classified before.

Thanks to the link posted by @Babel I was able to solve the problem @Babel I was able to solve the problem. Example for the green color:

  1. Use "Identify Features" "Identify Features" button on the input image and click on a number of green areas of the map.

  2. While doing so, note the entries in "Band1", "Band2", "Band3". Identify the maximum and minimum values for the respective color after collecting this data for a number of points. enter image description here

  3. Then open the "raster calculator" processing algorithm in QGIS enter image description here

  4. Use the following code to set the min and max for each band. Note that in my case the bands are called "coverage_geocoded". Further, the input layer / reference layer needs to be chosen.

"coverage_geocoded@1" > 40 and "coverage_geocoded@1" < 105 and

"coverage_geocoded@2" > 100 and "coverage_geocoded@2" < 165 and

"coverage_geocoded@3" > 50 and "coverage_geocoded@3" < 145

enter image description here

  1. Run algorithm. This creates a new layer with value equal to 1 if the respective section of the image is green:

enter image description here

Note: To find the "correct" min and max values I had to run the algorithm multiple times, while adjusting the values for points that were not correctly classified before.
Thanks to the link posted by @Babel, I was able to solve the problem. Example for the green color:

  1. Use "Identify Features" "Identify Features" button on the input image and click on a number of green areas of the map.

  2. While doing so, note the entries in "Band1", "Band2", "Band3". Identify the maximum and minimum values for the respective color after collecting this data for a number of points. enter image description here

  3. Then open the "raster calculator" processing algorithm in QGIS enter image description here

  4. Use the following code to set the min and max for each band. Note that in my case the bands are called "coverage_geocoded". Further, the input layer / reference layer needs to be chosen.

   "coverage_geocoded@1" > 40 and "coverage_geocoded@1" < 105 and 
   "coverage_geocoded@2" >  100 and "coverage_geocoded@2" < 165 and
   "coverage_geocoded@3"  > 50 and "coverage_geocoded@3" < 145

enter image description here

  1. Run algorithm. This creates a new layer with value equal to 1 if the respective section of the image is green:

enter image description here

Note: To find the "correct" min and max values I had to run the algorithm multiple times, while adjusting the values for points that were not correctly classified before.

Source Link

Thanks to the link posted by @Babel I was able to solve the problem @Babel I was able to solve the problem. Example for the green color:

  1. Use "Identify Features" "Identify Features" button on the input image and click on a number of green areas of the map.

  2. While doing so, note the entries in "Band1", "Band2", "Band3". Identify the maximum and minimum values for the respective color after collecting this data for a number of points. enter image description here

  3. Then open the "raster calculator" processing algorithm in QGIS enter image description here

  4. Use the following code to set the min and max for each band. Note that in my case the bands are called "coverage_geocoded". Further, the input layer / reference layer needs to be chosen.

"coverage_geocoded@1" > 40 and "coverage_geocoded@1" < 105 and

"coverage_geocoded@2" > 100 and "coverage_geocoded@2" < 165 and

"coverage_geocoded@3" > 50 and "coverage_geocoded@3" < 145

enter image description here

  1. Run algorithm. This creates a new layer with value equal to 1 if the respective section of the image is green:

enter image description here

Note: To find the "correct" min and max values I had to run the algorithm multiple times, while adjusting the values for points that were not correctly classified before.