Tweeted twitter.com/StackGIS/status/1620935099268141057
deleted 2 characters in body; edited title
Source Link
Kadir Şahbaz
  • 78k
  • 57
  • 257
  • 404

(GEE) constantConstant value in Chart after applying scaling factor to LANDSAT

(GEE) constantConstant value in Chart after applying scaling factor to LANDSAT

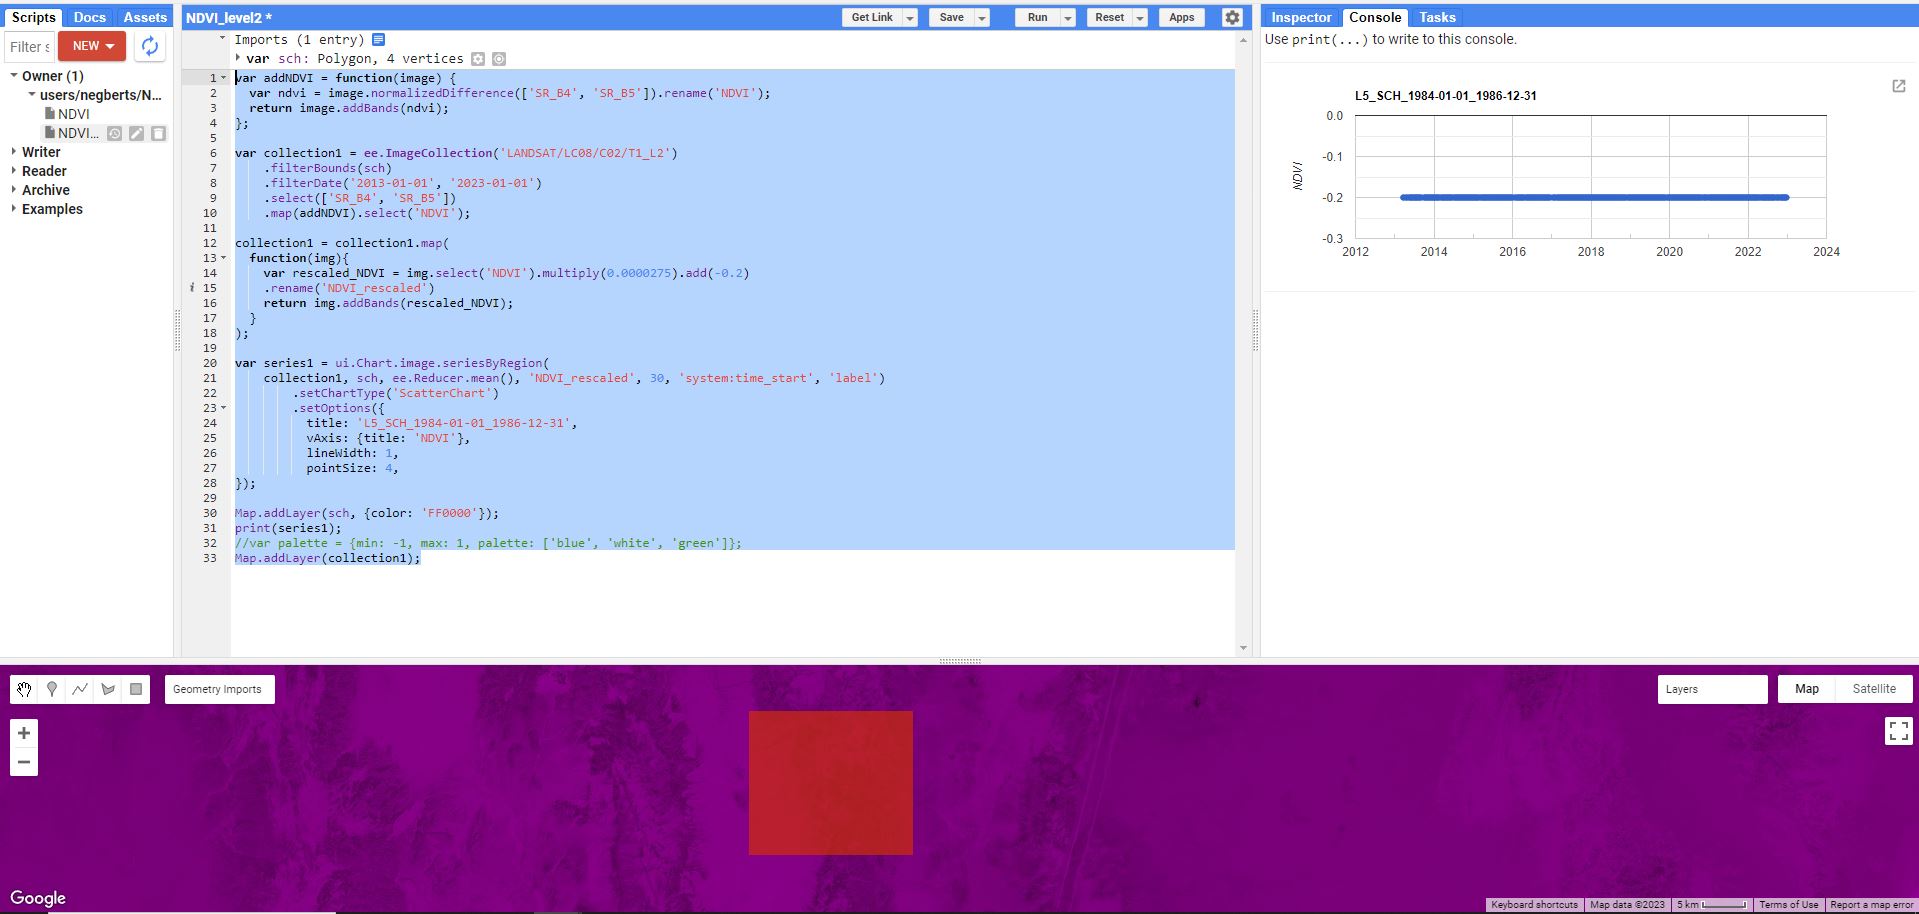
After applying a scaling factor to my LANDSAT collection 2 level 2 data the values seem to be off.

screen capture of code and output

var addNDVI = function(image) {
      var ndvi = image.normalizedDifference(['SR_B4', 'SR_B5']).rename('NDVI');
      return image.addBands(ndvi);
    };


var collection1 = ee.ImageCollection('LANDSAT/LC08/C02/T1_L2')
    .filterBounds(sch)
    .filterDate('2013-01-01', '2023-01-01')
    .select(['SR_B4', 'SR_B5'])
    .map(addNDVI).select('NDVI');

collection1 = collection1.map(
  function(img){
    var rescaled_NDVI = img.select('NDVI').multiply(0.0000275).add(-0.2)
    .rename('NDVI_rescaled')
    return img.addBands(rescaled_NDVI);
  }
);
  
var series1 = ui.Chart.image.seriesByRegion(
    collection1, sch, ee.Reducer.mean(), 'NDVI_rescaled', 30, 'system:time_start', 'label')
        .setChartType('ScatterChart')
        .setOptions({
          title: 'L5_SCH_1984-01-01_1986-12-31',
          vAxis: {title: 'NDVI'},
          lineWidth: 1,
          pointSize: 4,
});

Map.addLayer(sch, {color: 'FF0000'});
print(series1);
//var palette = {min: -1, max: 1, palette: ['blue', 'white', 'green']};
Map.addLayer(collection1);

(GEE) constant value after applying scaling factor to LANDSAT

After applying a scaling factor to my LANDSAT collection 2 level 2 data the values seem to be off.

screen capture of code and output

var addNDVI = function(image) {
      var ndvi = image.normalizedDifference(['SR_B4', 'SR_B5']).rename('NDVI');
      return image.addBands(ndvi);
    };


var collection1 = ee.ImageCollection('LANDSAT/LC08/C02/T1_L2')
    .filterBounds(sch)
    .filterDate('2013-01-01', '2023-01-01')
    .select(['SR_B4', 'SR_B5'])
    .map(addNDVI).select('NDVI');

collection1 = collection1.map(
  function(img){
    var rescaled_NDVI = img.select('NDVI').multiply(0.0000275).add(-0.2)
    .rename('NDVI_rescaled')
    return img.addBands(rescaled_NDVI);
  }
);
  
var series1 = ui.Chart.image.seriesByRegion(
    collection1, sch, ee.Reducer.mean(), 'NDVI_rescaled', 30, 'system:time_start', 'label')
        .setChartType('ScatterChart')
        .setOptions({
          title: 'L5_SCH_1984-01-01_1986-12-31',
          vAxis: {title: 'NDVI'},
          lineWidth: 1,
          pointSize: 4,
});

Map.addLayer(sch, {color: 'FF0000'});
print(series1);
//var palette = {min: -1, max: 1, palette: ['blue', 'white', 'green']};
Map.addLayer(collection1);

(GEE) Constant value in Chart after applying scaling factor to LANDSAT

After applying a scaling factor to my LANDSAT collection 2 level 2 data the values seem to be off.

screen capture of code and output

var addNDVI = function(image) {
      var ndvi = image.normalizedDifference(['SR_B4', 'SR_B5']).rename('NDVI');
      return image.addBands(ndvi);
    };


var collection1 = ee.ImageCollection('LANDSAT/LC08/C02/T1_L2')
    .filterBounds(sch)
    .filterDate('2013-01-01', '2023-01-01')
    .select(['SR_B4', 'SR_B5'])
    .map(addNDVI).select('NDVI');

collection1 = collection1.map(
  function(img){
    var rescaled_NDVI = img.select('NDVI').multiply(0.0000275).add(-0.2)
    .rename('NDVI_rescaled')
    return img.addBands(rescaled_NDVI);
  }
);
  
var series1 = ui.Chart.image.seriesByRegion(
    collection1, sch, ee.Reducer.mean(), 'NDVI_rescaled', 30, 'system:time_start', 'label')
        .setChartType('ScatterChart')
        .setOptions({
          title: 'L5_SCH_1984-01-01_1986-12-31',
          vAxis: {title: 'NDVI'},
          lineWidth: 1,
          pointSize: 4,
});

Map.addLayer(sch, {color: 'FF0000'});
print(series1);
//var palette = {min: -1, max: 1, palette: ['blue', 'white', 'green']};
Map.addLayer(collection1);
Source Link
N_LLC
  • 635
  • 3
  • 9

(GEE) constant value after applying scaling factor to LANDSAT

After applying a scaling factor to my LANDSAT collection 2 level 2 data the values seem to be off.

screen capture of code and output

var addNDVI = function(image) {
      var ndvi = image.normalizedDifference(['SR_B4', 'SR_B5']).rename('NDVI');
      return image.addBands(ndvi);
    };


var collection1 = ee.ImageCollection('LANDSAT/LC08/C02/T1_L2')
    .filterBounds(sch)
    .filterDate('2013-01-01', '2023-01-01')
    .select(['SR_B4', 'SR_B5'])
    .map(addNDVI).select('NDVI');

collection1 = collection1.map(
  function(img){
    var rescaled_NDVI = img.select('NDVI').multiply(0.0000275).add(-0.2)
    .rename('NDVI_rescaled')
    return img.addBands(rescaled_NDVI);
  }
);
  
var series1 = ui.Chart.image.seriesByRegion(
    collection1, sch, ee.Reducer.mean(), 'NDVI_rescaled', 30, 'system:time_start', 'label')
        .setChartType('ScatterChart')
        .setOptions({
          title: 'L5_SCH_1984-01-01_1986-12-31',
          vAxis: {title: 'NDVI'},
          lineWidth: 1,
          pointSize: 4,
});

Map.addLayer(sch, {color: 'FF0000'});
print(series1);
//var palette = {min: -1, max: 1, palette: ['blue', 'white', 'green']};
Map.addLayer(collection1);