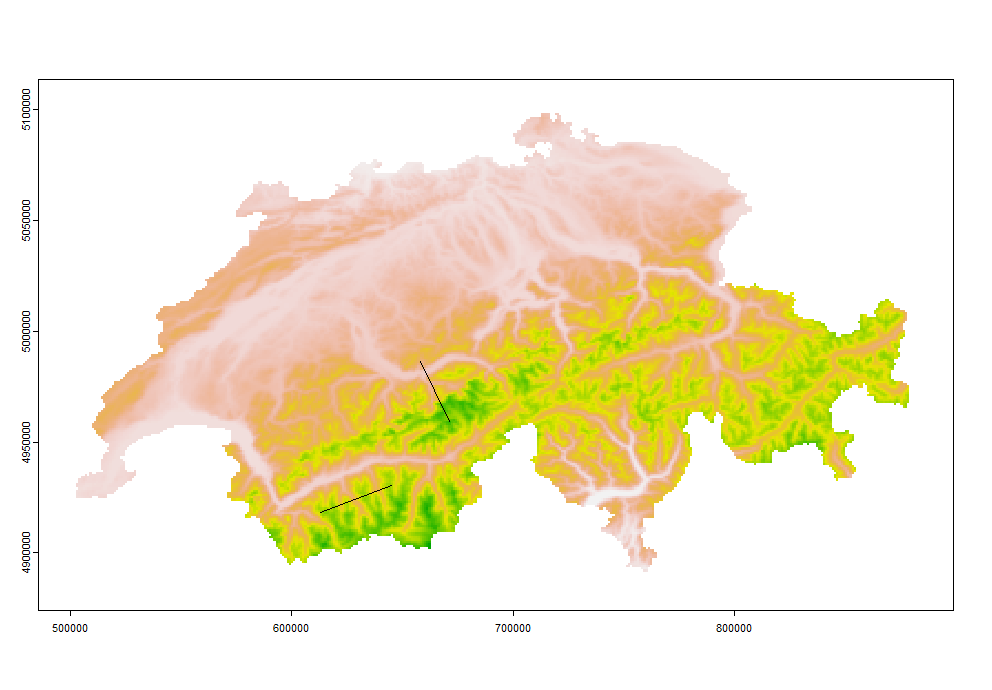
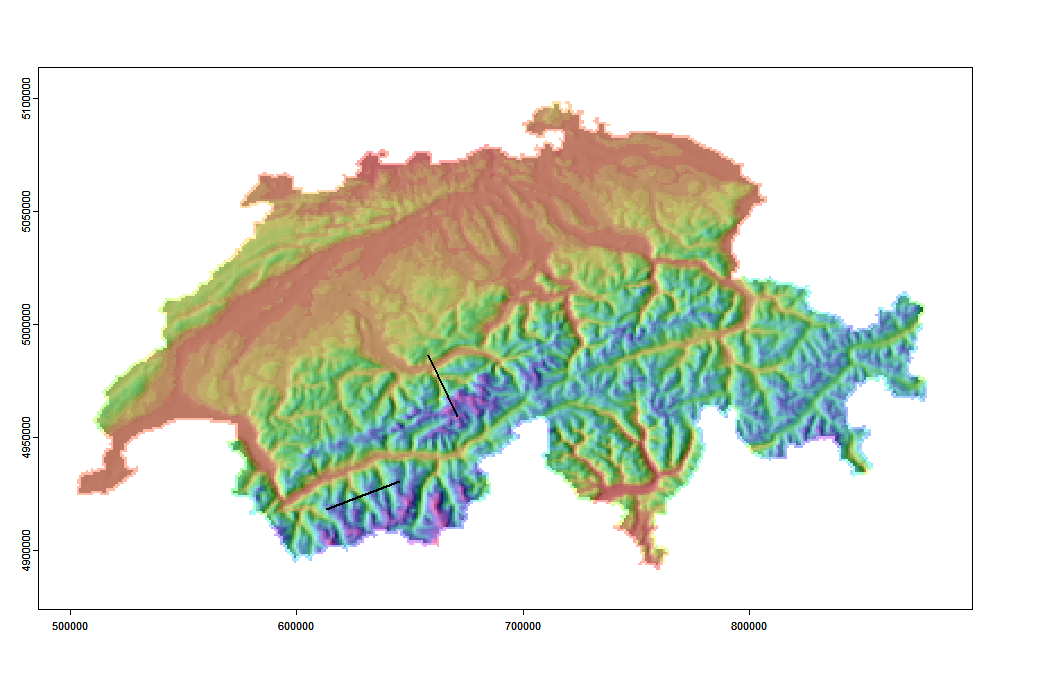
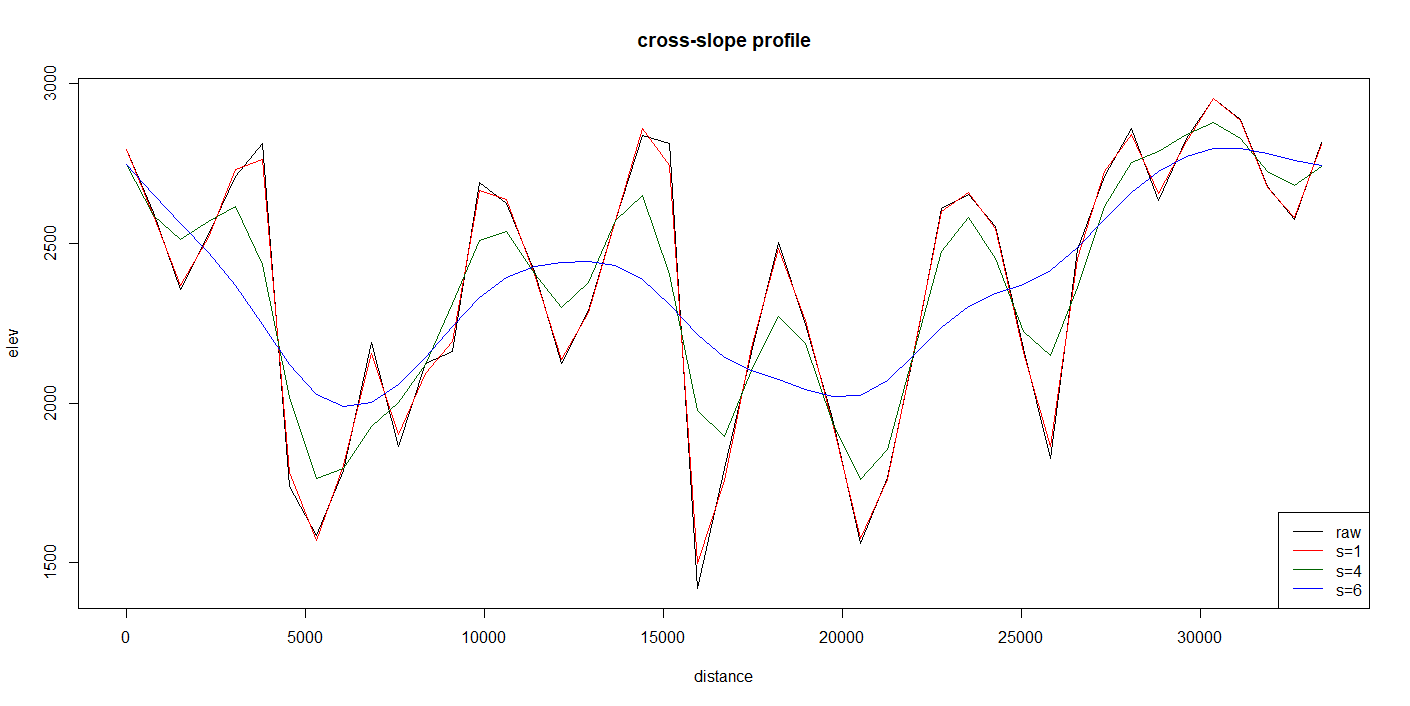
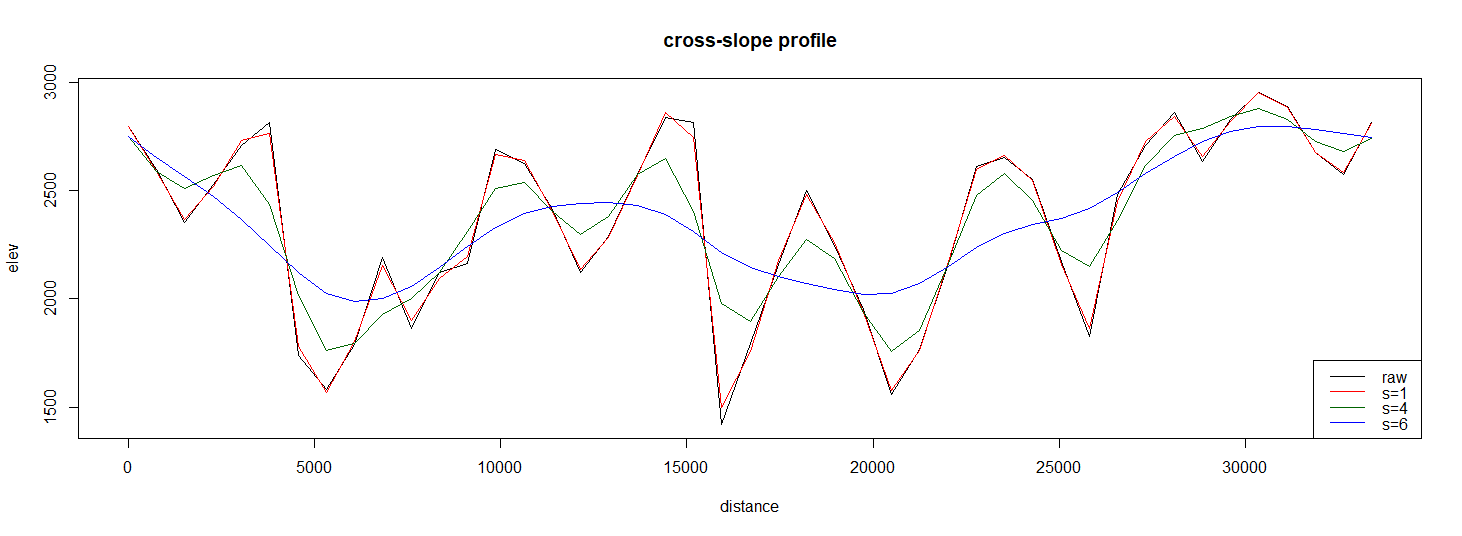
First, we add required libraries (note; spatialEco is only for the DEM), create 2 sf LINESTRING features representing down and cross slope profiles and, extract the elevation profiles which are then turned into a list object for plotting. We plot the profile lines on a shaded relief to better visualize the terrain.
library(spatialEco)
library(terra)
library(sf)
library(dplyr)

elev <- rast(system.file("extdata/elev.tif", package="spatialEco"))

cross <- data.frame(id=1, cbind(c(613160.2, 645160.2),c(4918281, 4930281)),
                    sequence=c(1,2))
  names(cross)[2:3] <- c("x","y")
down <- data.frame(id=2, cbind(c(658160.2, 671160.2),c(4986281, 4959281)),
                 sequence=c(1,2))
  names(down)[2:3] <- c("x","y")

xy <- rbind(cross, down)
  xy <- xy %>%
    st_as_sf(coords = c("x", "y"), crs = st_crs(elev)) %>%
      group_by(id) %>%
        summarize() %>%
          filter(st_geometry_type(.) == "MULTIPOINT") %>%
            st_cast("LINESTRING")

z <- extract(elev, vect(xy))
  z <- lapply(unique(z$ID), \(i) as.numeric(z[z$ID == i,][,2]))
    names(z) <- c("cross-slope", "down-slope")

slope <- terrain(elev, "slope", unit="radians")
aspect <- terrain(elev, "aspect", unit="radians")
hill <- shade(slope, aspect, 40, 270)
  plot(hill, col=grey(0:100/100), legend=FALSE, mar=c(2,2,1,4))
    plot(elev, col=rainbow(25, alpha=0.35), add=TRUE)
      plot(st_geometry(xy), lwd=1.5lwd=2, add=TRUE)


