added 254 characters in body
Source Link
Spacedman
  • 66.5k
  • 6
  • 83
  • 121

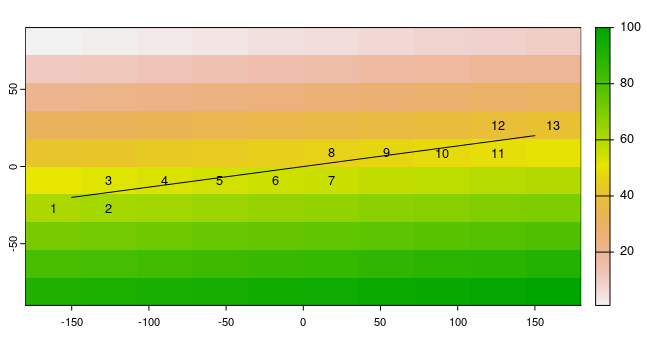
Another approach which saves having to densify, resulting in unnecessary duplicated samples which you might then want to thin out, may be to compute the distances of each sampled cell to the start of the line, and then re-order.

# I don't know how to get the x,y coords from a SpatVector, so convert to `sf`:
lsf = st_as_sf(l)
start = st_coordinates(lsf)[1,]

# working with `extract` as in the Q, add a distance column:
extract$d2 = (extract$x-start[1,1])^2 + (extract$y-start[1,2])^2

# copy with reordering by increasing distance    
e_order = extract[order(extract$d2),]

# add current ordering, and plot with ordering:
e_order$sample_order = 1:nrow(e_order)
plot(r)
plot(l, add=TRUE)
text(e_order$x, e_order$y, labels=e_order$sample_order, cex=0.8)

enter image description here

Note this only works for lines that are two points - for more complex linear features you need to split into simple two-point segments and loop, filtering out the duplicates you'd get where the end point of a segment is the start point of the next one.

Another approach which saves having to densify, resulting in unnecessary duplicated samples which you might then want to thin out, may be to compute the distances of each sampled cell to the start of the line, and then re-order.

# I don't know how to get the x,y coords from a SpatVector, so convert to `sf`:
lsf = st_as_sf(l)
start = st_coordinates(lsf)[1,]

# working with `extract` as in the Q, add a distance column:
extract$d2 = (extract$x-start[1,1])^2 + (extract$y-start[1,2])^2

# copy with reordering by increasing distance    
e_order = extract[order(extract$d2),]

# add current ordering, and plot with ordering:
e_order$sample_order = 1:nrow(e_order)
plot(r)
plot(l, add=TRUE)
text(e_order$x, e_order$y, labels=e_order$sample_order, cex=0.8)

enter image description here

Note this only works for lines that are two points - for more complex linear features you need to split into simple two-point segments and loop, filtering out the duplicates you'd get where the end point of a segment is the start point of the next one.

Source Link
Spacedman
  • 66.5k
  • 6
  • 83
  • 121

Another approach which saves having to densify, resulting in unnecessary duplicated samples which you might then want to thin out, may be to compute the distances of each sampled cell to the start of the line, and then re-order.

# I don't know how to get the x,y coords from a SpatVector, so convert to `sf`:
lsf = st_as_sf(l)
start = st_coordinates(lsf)[1,]

# working with `extract` as in the Q, add a distance column:
extract$d2 = (extract$x-start[1,1])^2 + (extract$y-start[1,2])^2

# copy with reordering by increasing distance    
e_order = extract[order(extract$d2),]

# add current ordering, and plot with ordering:
e_order$sample_order = 1:nrow(e_order)
plot(r)
plot(l, add=TRUE)
text(e_order$x, e_order$y, labels=e_order$sample_order, cex=0.8)

enter image description here