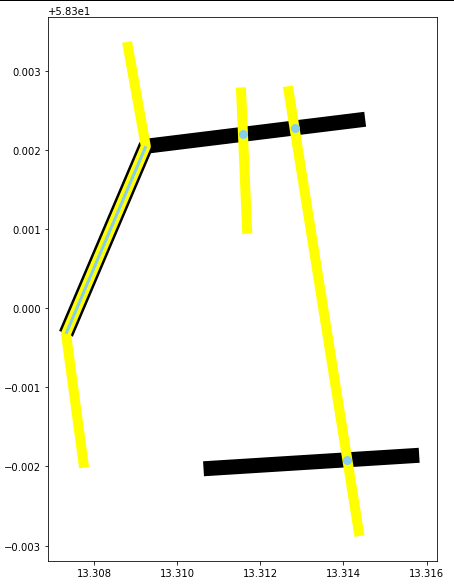
You can create a column of all geometry coordinates and explode by it:
import geopandas as gpd

layer1 = gpd.read_file(r"C:\GIS\GIStest\layer1.geojson") #The black lines in the plot
layer2 = gpd.read_file(r"C:\GIS\GIStest\layer2.geojson") #Yellow lines

inter = gpd.overlay(layer1, layer2, how="intersection", keep_geom_type=False) #Blue points and line
# print(inter)
# 0  LINESTRING (13.30732 58.29968, 13.30924 58.30205)
# 1                          POINT (13.31158 58.30220)
# 2                          POINT (13.31282 58.30228)
# 3                          POINT (13.31409 58.29808)

ax = layer1.plot(figsize=(10,10), linewidth=15, color="black", zorder=1)
layer2.plot(ax=ax, linewidth=10, color="yellow", zorder=2)
inter.plot(ax=ax, color="skyblue", zorder=3, linewidth=3)
inter["coords"] = inter.geometry.apply(lambda x: x.coords) #Extract all geometry coordinates
inter = inter.explode("coords") #Explode by the coordinatcoordinate sequence

#print(inter)
# 0  LINESTRING (13.30732 58.29968, 13.30924 58.30205)    (13.307323135774453, 58.2996779551392)
# 0  LINESTRING (13.30732 58.29968, 13.30924 58.30205)   (13.309244098550504, 58.30204903170543)
# 1                          POINT (13.31158 58.30220)  (13.311582383432421, 58.302200356511705)
# 2                          POINT (13.31282 58.30228)   (13.31282270444919, 58.302280625318566)
# 3                          POINT (13.31409 58.29808)   (13.314094087572387, 58.29808463744689)

