I made another typo and fixed it.
Source Link

Statistics for an asymmetric raster-cell neighborhood are required.

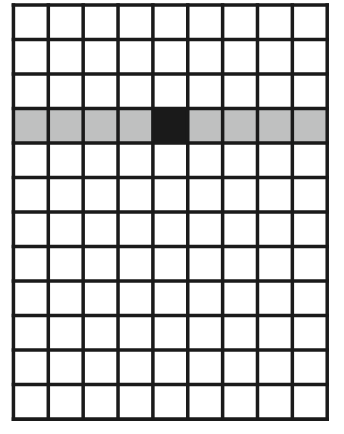
The application is modelling direct solar insolation over year-long time steps while accounting for local shading effects of vegetation for an ecosystem energy balance. Consider for instance that at certain times of year, the sun will be directly overhead. In this case, direct rays from the sun will trace a right-to-left (east-to-west) path. In the image below, the black box is the target cell and the grey boxes are the daily path of the sun.

enter image description here

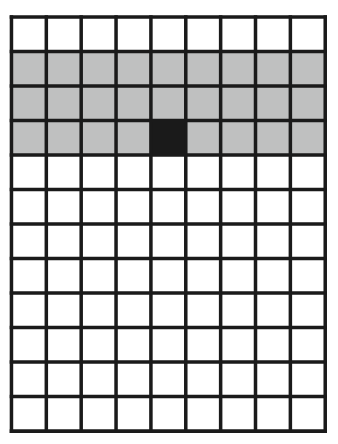
However, during other times of the year, the Earth tilts. When this happens, the direct rays entering the black square will be filtered through vegetation in a direction that is dependent on if the black square is located in the northern or southern hemisphereseason and this will have an important shading effect that must be considered. In the grid below, the black squarethis shading effect induced by Earth's tilt is located in the southern hemisphere and therepresented as grey squares representwith the cells in whichblack square again the vegetation can have a shading effecttarget cell.

enter image description here

The focal() function from terra can be used to calculate statistics for matrices, and according to the documentation, rows and/or columns of 'NA' can be added to modulate what window is used to generate statistics from. I am not certain how to create such a window.

In addition, focal() results in a statistic for a center cell. What this means is that, in the second image above where seasonal shading effect occur, the black cell would (by focal) be shifted up one. This needs to be adjusted or accounted for.

Statistics for an asymmetric raster-cell neighborhood are required.

The application is modelling direct solar insolation over year-long time steps while accounting for local shading effects of vegetation for an ecosystem energy balance. Consider for instance that at certain times of year, the sun will be directly overhead. In this case, direct rays from the sun will trace a right-to-left (east-to-west) path. In the image below, the black box is the target cell and the grey boxes are the daily path of the sun.

enter image description here

However, during other times of the year, the Earth tilts. When this happens, the direct rays entering the black square will be filtered through vegetation in a direction dependent on if the black square is located in the northern or southern hemisphere. In the grid below, the black square is located in the southern hemisphere and the grey squares represent the cells in which the vegetation can have a shading effect.

enter image description here

The focal() function from terra can be used to calculate statistics for matrices, and according to the documentation, rows and/or columns of 'NA' can be added to modulate what window is used to generate statistics from. I am not certain how to create such a window.

In addition, focal() results in a statistic for a center cell. What this means is that, in the second image above where seasonal shading effect occur, the black cell would (by focal) be shifted up one. This needs to be adjusted or accounted for.
Statistics for an asymmetric raster-cell neighborhood are required.

The application is modelling direct solar insolation over year-long time steps while accounting for local shading effects of vegetation for an ecosystem energy balance. Consider for instance that at certain times of year, the sun will be directly overhead. In this case, direct rays from the sun will trace a right-to-left (east-to-west) path. In the image below, the black box is the target cell and the grey boxes are the daily path of the sun.

enter image description here

However, during other times of the year, the Earth tilts. When this happens, the direct rays entering the black square will be filtered through vegetation in a direction that is dependent on the season and this will have an important shading effect that must be considered. In the grid below, this shading effect induced by Earth's tilt is represented as grey squares with the black square again the target cell.

enter image description here

The focal() function from terra can be used to calculate statistics for matrices, and according to the documentation, rows and/or columns of 'NA' can be added to modulate what window is used to generate statistics from. I am not certain how to create such a window.

In addition, focal() results in a statistic for a center cell. What this means is that, in the second image above where seasonal shading effect occur, the black cell would (by focal) be shifted up one. This needs to be adjusted or accounted for.

Edit in response to Spacedman's comment response to my comment. Purpose for edit is to provide further context on what the grids represent to make clearer how focal() does not provide the solution requested.
Source Link

I want statisticsStatistics for an asymmetric raster-cell neighborhood are required.

This script yields symmetric rasterThe application is modelling direct solar insolation over year-cell neighborhood

    library(terra)
    r <- matrix(1:(12*9),c(12,9))
    rr <-rast(r)
    rrr <- focal(rr,9,fun="sum")

long time steps while accounting for local shading effects of vegetation for an ecosystem energy balance. Consider for instance that looks likeat certain times of year, the sun will be directly overhead. In this case, direct rays from the sun will trace a right-to-left (the dark celleast-to-west) path. In the image below, the black box is what the statisticstarget cell and the grey boxes are calculated for from the gray cells):daily path of the sun.

enter image description here

However, I am after something that looks likeduring other times of the year, the Earth tilts. When this (noticehappens, the dark celldirect rays entering the black square will be filtered through vegetation in a direction dependent on if the black square is not centeredlocated in the graynorthern or southern hemisphere. In the grid below, the black square is located in the southern hemisphere and the grey squares represent the cells): in which the vegetation can have a shading effect.

enter image description here

The focal() function from terra can be used to calculate statistics for matrices, and according to the documentation, rows and/or columns of 'NA' can be added to modulate what window is used to generate statistics from. I am not certain how to create such a window.

In addition, focal() results in a statistic for a center cell. What this means is that, in the second image above where seasonal shading effect occur, the darkblack cell would (by focal) be shifted up one. I am not certain how or if the cell targeted in focal() around which the window is wrapped canThis needs to be shifted down oneadjusted or accounted for.

I want statistics for asymmetric raster-cell neighborhood.

This script yields symmetric raster-cell neighborhood

    library(terra)
    r <- matrix(1:(12*9),c(12,9))
    rr <-rast(r)
    rrr <- focal(rr,9,fun="sum")

that looks like this (the dark cell is what the statistics are calculated for from the gray cells):

enter image description here

However, I am after something that looks like this (notice, the dark cell is not centered in the gray cells):

enter image description here

The focal() function from terra can be used to calculate statistics for matrices, and according to the documentation, rows and/or columns of 'NA' can be added to modulate what window is used to generate statistics from. I am not certain how to create such a window.

In addition, focal() results in a statistic for a center cell. What this means is that, in the second image above, the dark cell would be shifted up one. I am not certain how or if the cell targeted in focal() around which the window is wrapped can be shifted down one.

Statistics for an asymmetric raster-cell neighborhood are required.

The application is modelling direct solar insolation over year-long time steps while accounting for local shading effects of vegetation for an ecosystem energy balance. Consider for instance that at certain times of year, the sun will be directly overhead. In this case, direct rays from the sun will trace a right-to-left (east-to-west) path. In the image below, the black box is the target cell and the grey boxes are the daily path of the sun.

enter image description here

However, during other times of the year, the Earth tilts. When this happens, the direct rays entering the black square will be filtered through vegetation in a direction dependent on if the black square is located in the northern or southern hemisphere. In the grid below, the black square is located in the southern hemisphere and the grey squares represent the cells in which the vegetation can have a shading effect.

enter image description here

The focal() function from terra can be used to calculate statistics for matrices, and according to the documentation, rows and/or columns of 'NA' can be added to modulate what window is used to generate statistics from. I am not certain how to create such a window.

In addition, focal() results in a statistic for a center cell. What this means is that, in the second image above where seasonal shading effect occur, the black cell would (by focal) be shifted up one. This needs to be adjusted or accounted for.

@Spacedman provided a solution however it is not complete. I added context to the question so that what I am after is more clear.
Source Link

I want statistics for asymmetric raster-cell neighborhood.

This script yields symmetric raster-cell neighborhood

    library(terra)
    r <- matrix(1:(12*9),c(12,9))
    rr <-rast(r)
    rrr <- focal(rr,9,fun="sum")

that looks like this (the dark cell is what the statistics are calculated for from the gray cells):

enter image description here

However, I am after something that looks like this (notice, the dark cell is not centered in the gray cells):

enter image description here

The focal() function from terra can be used to calculate statistics for matrices, and according to the documentation, rows and/or columns of 'NA' can be added to modulate what window is used to generate statistics from - this would enable statistics from asymmetric neighbourhoods to be calculated. However, I doam not knowcertain how to include rows of 'NA'create such a window. 

In addition, statistics would ideally be producedfocal() results in timely mannera statistic for a much large rastercenter cell. What this means is that, iin the second image above, the dark cell would be shifted up one.e I am not certain how or if the cell targeted in focal() around which the window is wrapped can be shifted down one.:

   da_big_un <- rast(matrix(1:(10^5)^2,c(10^5,10^5))) 

I want statistics for asymmetric raster-cell neighborhood.

This script yields symmetric raster-cell neighborhood

    library(terra)
    r <- matrix(1:(12*9),c(12,9))
    rr <-rast(r)
    rrr <- focal(rr,9,fun="sum")

that looks like this (the dark cell is what the statistics are calculated for from the gray cells):

enter image description here

However, I am after something that looks like this (notice, the dark cell is not centered in the gray cells):

enter image description here

The focal() function from terra can be used to calculate statistics for matrices, and according to the documentation, rows and/or columns of 'NA' can be added to modulate what window is used to generate statistics from - this would enable statistics from asymmetric neighbourhoods to be calculated. However, I do not know how to include rows of 'NA'. In addition, statistics would ideally be produced in timely manner for a much large raster, i.e.:

   da_big_un <- rast(matrix(1:(10^5)^2,c(10^5,10^5))) 

I want statistics for asymmetric raster-cell neighborhood.

This script yields symmetric raster-cell neighborhood

    library(terra)
    r <- matrix(1:(12*9),c(12,9))
    rr <-rast(r)
    rrr <- focal(rr,9,fun="sum")

that looks like this (the dark cell is what the statistics are calculated for from the gray cells):

enter image description here

However, I am after something that looks like this (notice, the dark cell is not centered in the gray cells):

enter image description here

The focal() function from terra can be used to calculate statistics for matrices, and according to the documentation, rows and/or columns of 'NA' can be added to modulate what window is used to generate statistics from. I am not certain how to create such a window. 

In addition, focal() results in a statistic for a center cell. What this means is that, in the second image above, the dark cell would be shifted up one. I am not certain how or if the cell targeted in focal() around which the window is wrapped can be shifted down one.

English usage
Source Link
Vince
  • 20.3k
  • 16
  • 48
  • 65
Loading
Source Link
Loading