added 1 character in body
Source Link
user2856
  • 69.6k
  • 6
  • 119
  • 203

That looks as expected to me.

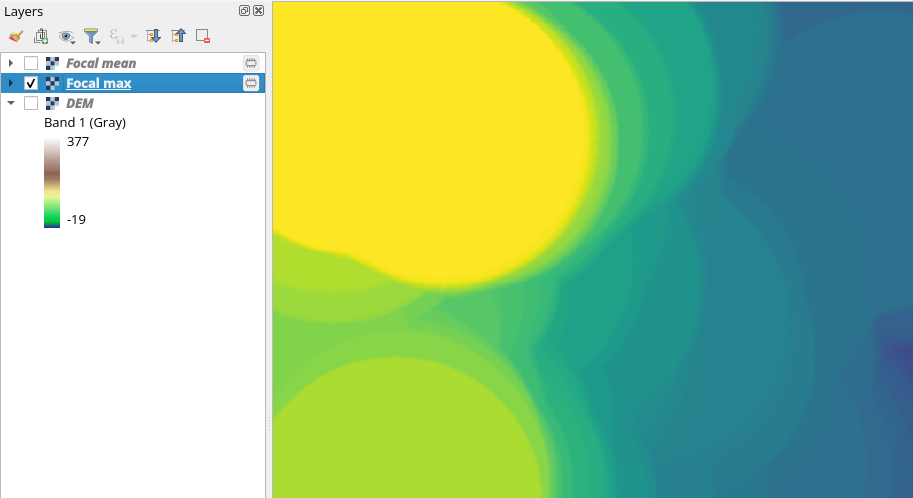
The algorithm finds the maximum value in a circle neighbourhood around each cell. For any given cell in a circular looking pattern in the output (e.g. in the lower left of your example, note that I'm not talking about the circle neighbourhood used in the focal algorithm, but the visual circular patterns in the output), even for cells towards the outer edge of that visual circle pattern, the maximum value is always going to be the value in the centre of the pattern.

Consider the overall maximum value of the whole raster. All cells within a circle around that value will get assigned that value because a circular focal neighbourhood droppedcentered over any of those cells will include that maximum value. Once your circular focal neighbourhood gets more than 2000 cells (circle radius) away from that particular maximum value then the maximum value changes.

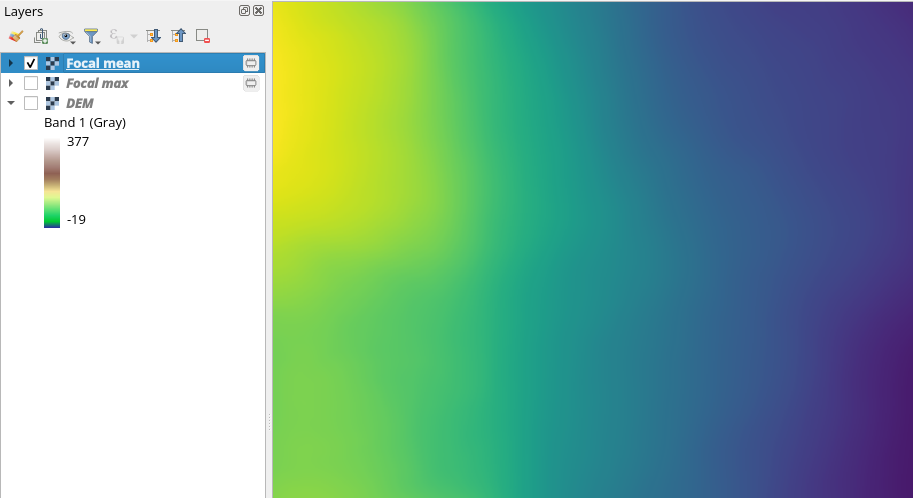
If you want to see a more continuous output, use a continuous statistic like mean.

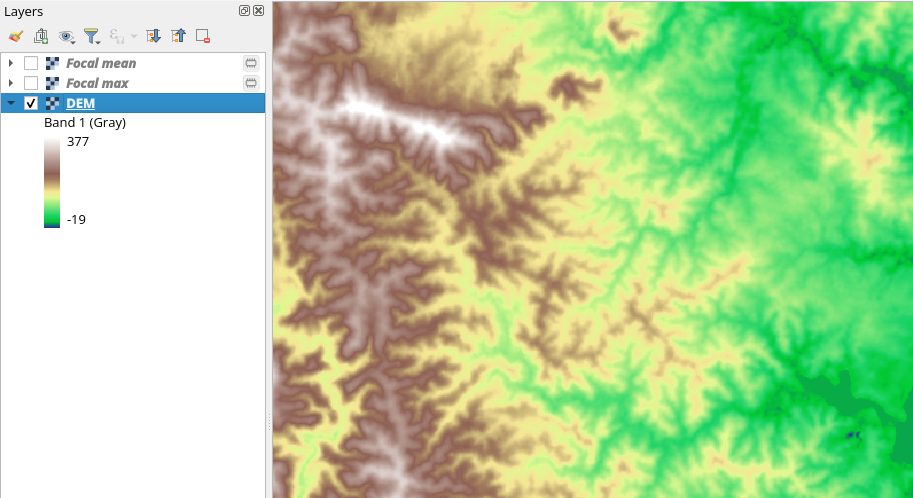
This is using QGIS and GRASS r.neighbors, but the algorithm is the same:

Input raster

enter image description here

Focal max, note circles in output

enter image description here

Focal mean, much smoother

enter image description here

That looks as expected to me.

The algorithm finds the maximum value in a circle neighbourhood around each cell. For any given cell in a circular looking pattern in the output (e.g. in the lower left of your example, note that I'm not talking about the circle neighbourhood used in the focal algorithm, but the visual circular patterns in the output), even for cells towards the outer edge of that visual circle pattern, the maximum value is always going to be the value in the centre of the pattern.

Consider the overall maximum value of the whole raster. All cells within a circle around that value will get assigned that value because a circular focal neighbourhood dropped over any of those cells will include that maximum value. Once your circular focal neighbourhood gets more than 2000 cells (circle radius) away from that particular maximum value then the maximum value changes.

If you want to see a more continuous output, use a continuous statistic like mean.

This is using QGIS and GRASS r.neighbors, but the algorithm is the same:

Input raster

enter image description here

Focal max, note circles in output

enter image description here

Focal mean, much smoother

enter image description here

That looks as expected to me.

The algorithm finds the maximum value in a circle neighbourhood around each cell. For any given cell in a circular looking pattern in the output (e.g. in the lower left of your example, note that I'm not talking about the circle neighbourhood used in the focal algorithm, but the visual circular patterns in the output), even for cells towards the outer edge of that visual circle pattern, the maximum value is always going to be the value in the centre of the pattern.

Consider the overall maximum value of the whole raster. All cells within a circle around that value will get assigned that value because a circular focal neighbourhood centered over any of those cells will include that maximum value. Once your circular focal neighbourhood gets more than 2000 cells (circle radius) away from that particular maximum value then the maximum value changes.

If you want to see a more continuous output, use a continuous statistic like mean.

This is using QGIS and GRASS r.neighbors, but the algorithm is the same:

Input raster

enter image description here

Focal max, note circles in output

enter image description here

Focal mean, much smoother

enter image description here

added 23 characters in body
Source Link
user2856
  • 69.6k
  • 6
  • 119
  • 203

That looks as expected to me.

The algorithm finds the maximum value in a circle neighbourhood around each cell. For any given cell in a circular looking pattern in the output (e.g. in the lower left of your example, note that I'm not talking about the circle neighbourhood used in the focal algorithm, but the visual circlecircular patterns in the output), even for cells towards the outer edge of that visual circle pattern, the maximum value is always going to be the value in the centre of the pattern.

Consider the overall maximum value of the whole raster. All cells within a circle around that value will get assigned that value because a circular focal neighbourhood dropped over any of those cells will include that maximum value. Once your circular focal neighbourhood gets more than 2000 cells (circle radius) away from that particular maximum value then the maxiumummaximum value changes.

If you want to see a more continuous output, use a continuous statistic like mean.

This is using QGIS and GRASS r.neighbors, but the algorithm is the same:

Input raster

enter image description here

Focal max, note circles in output

enter image description here

Focal mean, much smoother

enter image description here

That looks as expected to me.

The algorithm finds the maximum value in a circle around each cell. For any given cell in a circular looking pattern in the output (e.g. in the lower left of your example, note that I'm not talking about the circle neighbourhood used in the focal algorithm, but the visual circle patterns in the output), even for cells towards the outer edge of that visual circle, the maximum value is always going to be the value in the centre of the pattern.

Consider the overall maximum value of the whole raster. All cells within a circle around that value will get assigned that value because a circular focal neighbourhood dropped over any of those cells will include that maximum value. Once your circular focal neighbourhood gets more than 2000 cells (circle radius) away from that particular maximum value then the maxiumum value changes.

If you want to see a more continuous output, use a continuous statistic like mean.

This is using QGIS and GRASS r.neighbors, but the algorithm is the same:

Input raster

enter image description here

Focal max, note circles in output

enter image description here

Focal mean, much smoother

enter image description here

That looks as expected to me.

The algorithm finds the maximum value in a circle neighbourhood around each cell. For any given cell in a circular looking pattern in the output (e.g. in the lower left of your example, note that I'm not talking about the circle neighbourhood used in the focal algorithm, but the visual circular patterns in the output), even for cells towards the outer edge of that visual circle pattern, the maximum value is always going to be the value in the centre of the pattern.

Consider the overall maximum value of the whole raster. All cells within a circle around that value will get assigned that value because a circular focal neighbourhood dropped over any of those cells will include that maximum value. Once your circular focal neighbourhood gets more than 2000 cells (circle radius) away from that particular maximum value then the maximum value changes.

If you want to see a more continuous output, use a continuous statistic like mean.

This is using QGIS and GRASS r.neighbors, but the algorithm is the same:

Input raster

enter image description here

Focal max, note circles in output

enter image description here

Focal mean, much smoother

enter image description here

added 231 characters in body
Source Link
user2856
  • 69.6k
  • 6
  • 119
  • 203

That looks as expected to me.

The algorithm finds the maximum value in a circle around each cell. For any given cell in a circular looking pattern in the output (e.g. in the lower left of your example, note that I'm not talking about the circle neighbourhood used in the focal algorithm, but the visual circle patterns in the output), even for cells towards the outer edge of that visual circle, the maximum value is always going to be the value in the centre of the pattern.

Because onceConsider the overall maximum value of the whole raster. All cells within a circle around that value will get assigned that value because a circular focal neighbourhood dropped over any of those cells will include that maximum value. Once your circular focal alg circle neighbourhood gets more than 2000 cells (circle radius) away from that particular maximum value then the maxiumum value changes.

If you want to see a more continuous output, use a continuous statistic like mean.

This is using QGIS and GRASS r.neighbors, but the algorithm is the same:

Input raster

enter image description here

Focal max, note circles in output

enter image description here

Focal mean, much smoother

enter image description here

That looks as expected to me.

The algorithm finds the maximum value in a circle around each cell. For any given cell in a circular looking pattern in the output (e.g. in the lower left of your example, note that I'm not talking about the circle neighbourhood used in the focal algorithm, but the visual circle patterns in the output), even for cells towards the outer edge of that visual circle, the maximum value is always going to be the value in the centre of the pattern.

Because once your focal alg circle neighbourhood gets more than 2000 cells (circle radius) away from that particular value then the maxiumum value changes.

If you want to see a more continuous output, use a continuous statistic like mean.

This is using QGIS and GRASS r.neighbors, but the algorithm is the same:

Input raster

enter image description here

Focal max, note circles in output

enter image description here

Focal mean, much smoother

enter image description here

That looks as expected to me.

The algorithm finds the maximum value in a circle around each cell. For any given cell in a circular looking pattern in the output (e.g. in the lower left of your example, note that I'm not talking about the circle neighbourhood used in the focal algorithm, but the visual circle patterns in the output), even for cells towards the outer edge of that visual circle, the maximum value is always going to be the value in the centre of the pattern.

Consider the overall maximum value of the whole raster. All cells within a circle around that value will get assigned that value because a circular focal neighbourhood dropped over any of those cells will include that maximum value. Once your circular focal neighbourhood gets more than 2000 cells (circle radius) away from that particular maximum value then the maxiumum value changes.

If you want to see a more continuous output, use a continuous statistic like mean.

This is using QGIS and GRASS r.neighbors, but the algorithm is the same:

Input raster

enter image description here

Focal max, note circles in output

enter image description here

Focal mean, much smoother

enter image description here

Source Link
user2856
  • 69.6k
  • 6
  • 119
  • 203
Loading