removed thanks
Source Link
Vince
  • 20.3k
  • 16
  • 48
  • 65

I have a table with 2 million records in PostGIS:

    CREATE TABLE public.trips(
    id int4 NULL,
    name text NULL,
    public_start_point public.geometry(point, 4326) NULL,
    stop_point public.geometry(point, 4326) NULL,
    route public.geometry(linestring, 4326) NULL);

So far, I have successfully generated a vector tile of the trips using Tippecanoe and developed a Node.js app to serve them to the client, which is built using React.js and Mapbox GL. As a backend developer working on a GIS project for the first time, I am trying to build a map similar to the Strava heatmap where I can display the lines (routes) based on their density in a neon style, as well as a heatmap based on the start points. My goal is to have roads with more activity appear darker than those with less.

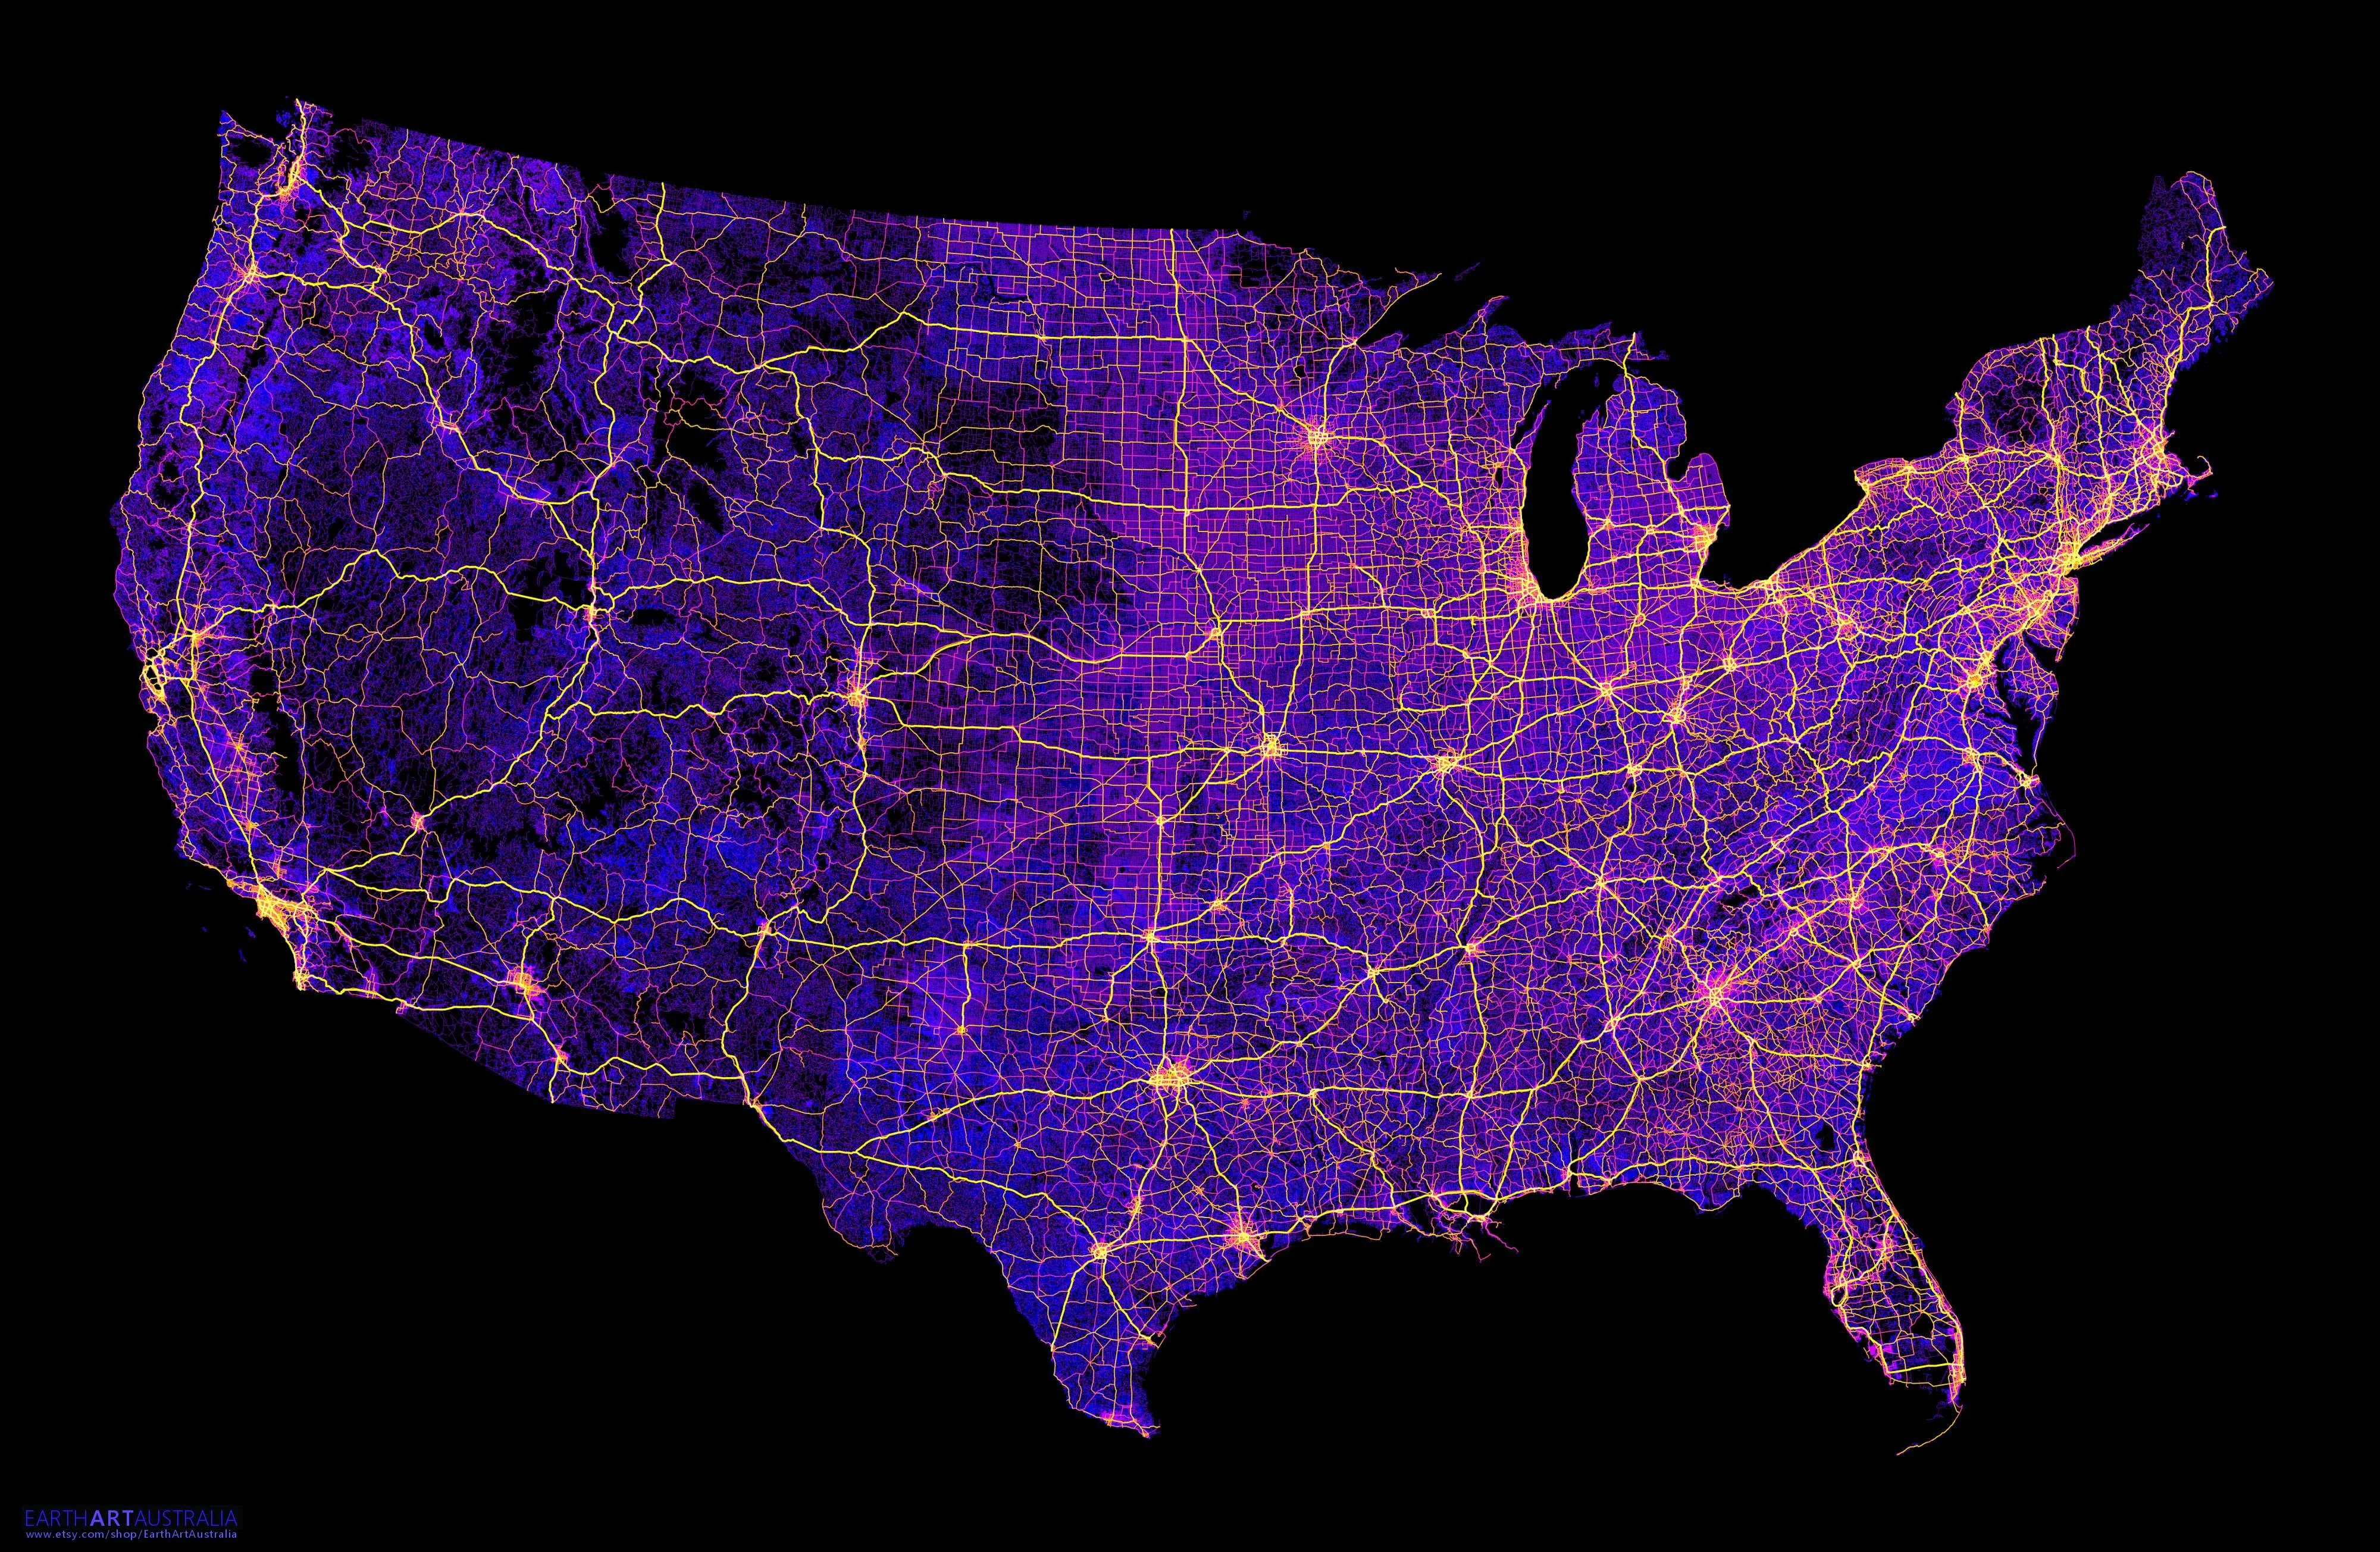
As an example of what I need, below is a picture of traffic data in the United States, which illustrates the kind of visualization I am aiming for.

enter image description here

I have done some research on creating heatmaps, but most resources focus on regular heatmaps rather than linestring-based ones.

My questions are:

Can this be done using vector tiles, or must it be in the form of a raster? What approaches, concepts, or tools should I be aware of to create a linestring-based heatmap? Thank you for your help!

I have a table with 2 million records in PostGIS:

    CREATE TABLE public.trips(
    id int4 NULL,
    name text NULL,
    public_start_point public.geometry(point, 4326) NULL,
    stop_point public.geometry(point, 4326) NULL,
    route public.geometry(linestring, 4326) NULL);

So far, I have successfully generated a vector tile of the trips using Tippecanoe and developed a Node.js app to serve them to the client, which is built using React.js and Mapbox GL. As a backend developer working on a GIS project for the first time, I am trying to build a map similar to the Strava heatmap where I can display the lines (routes) based on their density in a neon style, as well as a heatmap based on the start points. My goal is to have roads with more activity appear darker than those with less.

As an example of what I need, below is a picture of traffic data in the United States, which illustrates the kind of visualization I am aiming for.

enter image description here

I have done some research on creating heatmaps, but most resources focus on regular heatmaps rather than linestring-based ones.

My questions are:

Can this be done using vector tiles, or must it be in the form of a raster? What approaches, concepts, or tools should I be aware of to create a linestring-based heatmap?

Source Link

Creating a Linestring-Based Heatmap with Vector Tiles in PostGIS

I have a table with 2 million records in PostGIS:

    CREATE TABLE public.trips(
    id int4 NULL,
    name text NULL,
    public_start_point public.geometry(point, 4326) NULL,
    stop_point public.geometry(point, 4326) NULL,
    route public.geometry(linestring, 4326) NULL);

So far, I have successfully generated a vector tile of the trips using Tippecanoe and developed a Node.js app to serve them to the client, which is built using React.js and Mapbox GL. As a backend developer working on a GIS project for the first time, I am trying to build a map similar to the Strava heatmap where I can display the lines (routes) based on their density in a neon style, as well as a heatmap based on the start points. My goal is to have roads with more activity appear darker than those with less.

As an example of what I need, below is a picture of traffic data in the United States, which illustrates the kind of visualization I am aiming for.

enter image description here

I have done some research on creating heatmaps, but most resources focus on regular heatmaps rather than linestring-based ones.

My questions are:

Can this be done using vector tiles, or must it be in the form of a raster? What approaches, concepts, or tools should I be aware of to create a linestring-based heatmap? Thank you for your help!