Bounty Ended with no winning answer by CommunityBot
Bounty Started worth 50 reputation by Alice
Bounty Ended with no winning answer by CommunityBot
added 258 characters in body
Source Link
Alice
  • 417
  • 5
  • 16

I am completely re-writing my question as i think it was quite confusing before:

I have a number of different points, each point has a -z value. I need to create some sort of raster or a series of polygons which buffers these points.. but i have a few complicated rules!

  1. If the adjacent points are of the same z value then the buffer must merge into one polygon.
  2. if the adjacent point is a different z value - then the buffers must be weighted in accordance to the depth of the z values, i.e. if one z-value is -10, and the other is -5, then the buffer of the -10 point will take up 75% of the distance between the 2 points. But because there are many points, and they are all related, this buffering will be different on different sides of the point, see diagram!![enter image description here][1] [1]: https://i.sstatic.net/Zoo0R.png
  3. The idea of the weighted voronoi diagram has been suggested to me and that would be perfect if it weren't for all of the points being related to all of the points around its!
  4. I know how i would do it on paper - i would divide the space between all points by 10, and then based on the difference between the two points choose where the buffer would start (if there is no difference between the points then the buffer starts in the middle).
  5. Although i cannot work out the formula for determining where the buffer starts.. i know it must be derived from the DIFFERENCE between the two points - but i do not have the mathmatical capacity to work out how i would use this to work out the distance!

I am using Arcmap 9.3.1 and am open to python scripting! If you need me to try and explain anything further i will try! i am very confused myself!

I am completely re-writing my question as i think it was quite confusing before:

I have a number of different points, each point has a -z value. I need to create some sort of raster or a series of polygons which buffers these points.. but i have a few complicated rules!

  1. If the adjacent points are of the same z value then the buffer must merge into one polygon.
  2. if the adjacent point is a different z value - then the buffers must be weighted in accordance to the depth of the z values, i.e. if one z-value is -10, and the other is -5, then the buffer of the -10 point will take up 75% of the distance between the 2 points. But because there are many points, and they are all related, this buffering will be different on different sides of the point, see diagram!![enter image description here][1] [1]: https://i.sstatic.net/Zoo0R.png
  3. The idea of the weighted voronoi diagram has been suggested to me and that would be perfect if it weren't for all of the points being related to all of the points around its!
  4. I know how i would do it on paper - i would divide the space between all points by 10, and then based on the difference between the two points choose where the buffer would start (if there is no difference between the points then the buffer starts in the middle).

I am using Arcmap 9.3.1 and am open to python scripting! If you need me to try and explain anything further i will try! i am very confused myself!
I am completely re-writing my question as i think it was quite confusing before:

I have a number of different points, each point has a -z value. I need to create some sort of raster or a series of polygons which buffers these points.. but i have a few complicated rules!

  1. If the adjacent points are of the same z value then the buffer must merge into one polygon.
  2. if the adjacent point is a different z value - then the buffers must be weighted in accordance to the depth of the z values, i.e. if one z-value is -10, and the other is -5, then the buffer of the -10 point will take up 75% of the distance between the 2 points. But because there are many points, and they are all related, this buffering will be different on different sides of the point, see diagram!![enter image description here][1] [1]: https://i.sstatic.net/Zoo0R.png
  3. The idea of the weighted voronoi diagram has been suggested to me and that would be perfect if it weren't for all of the points being related to all of the points around its!
  4. I know how i would do it on paper - i would divide the space between all points by 10, and then based on the difference between the two points choose where the buffer would start (if there is no difference between the points then the buffer starts in the middle).
  5. Although i cannot work out the formula for determining where the buffer starts.. i know it must be derived from the DIFFERENCE between the two points - but i do not have the mathmatical capacity to work out how i would use this to work out the distance!

I am using Arcmap 9.3.1 and am open to python scripting! If you need me to try and explain anything further i will try! i am very confused myself!

Bounty Started worth 50 reputation by Alice
deleted 750 characters in body
Source Link
Alice
  • 417
  • 5
  • 16

I am looking ofcompletely re-writing my question as i think it was quite confusing before:

I have a way to displaynumber of different points, each point data ashas a raster - each point will have a zz value.. and i want the raster to be based upon these values (please see my terrible drawing!). I think that using Zonal Geometry is the way to do this - but the problem is that i I need each value to be weighted differently. E.g. if the z valuecreate some sort of raster or a point is -24, and the z valueseries of the next point is -20, then the area around the -24 point should be larger than the area around the -20 point based on some rulespolygons which buffers these points.. but i have been given.a few complicated rules!

  1. If the adjacent points are of the same z value then the buffer must merge into one polygon.
  2. if the adjacent point is a different z value - then the buffers must be weighted in accordance to the depth of the z values, i.e. if one z-value is -10, and the other is -5, then the buffer of the -10 point will take up 75% of the distance between the 2 points. But because there are many points, and they are all related, this buffering will be different on different sides of the point, see diagram!![enter image description here][1] [1]: https://i.sstatic.net/Zoo0R.png
  3. The idea of the weighted voronoi diagram has been suggested to me and that would be perfect if it weren't for all of the points being related to all of the points around its!
  4. I know how i would do it on paper - i would divide the space between all points by 10, and then based on the difference between the two points choose where the buffer would start (if there is no difference between the points then the buffer starts in the middle).

Is this something i will have to try and script? Or is there a way of doing it within the GIS? I am running ArcMapusing Arcmap 9.3.1. and would definitely rather avoidam open to python scripting!

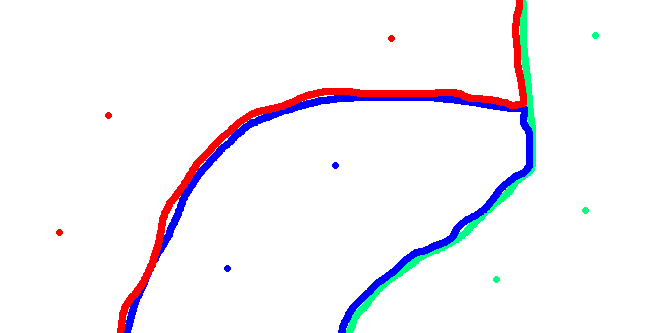
EDIT Obviously i wasnt very clear!! The points of different colours represent points with the same Z values. What i want is for them to be buffered to a distance which is dependant on their Z value. So if the z-value of a point is -20, and the point next to it is -24, i want to point with a -24 z-valueIf you need me to be buffered by 2/3rds of the distance between ittry and the -20 point! Its quite difficult to explain.. The rules i have been givern govern how much space each buffer should take up (2/3rds, 1/2, etc!) So as i gather it i would be interpolating between points of equal Z-values - but the amount of space they take up would be goverened by the z-values themselves! Confusing!

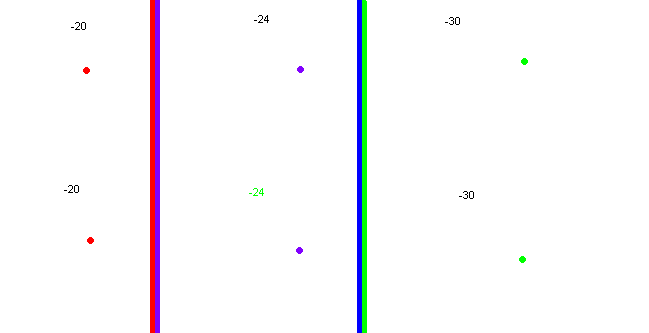
The buffering rules anything further i have been given are like this: If the z-value of one point is -20, and the z value of the point next to it is -24, then the point with the -24 zvalue will take up 2/3rds of the space between the 2 points. If both points are equal to -20 then each buffer will take up 1/2 of the space between the 2 points. Here is another crudely drawn picture to try and explain!

EDIT I have posted my question on the ESRI forums in a different wording http://forums.arcgis.com/threads/29731-Weighted-buffering-solution!?p=99414#post99414 I think my solution is to make buffers then to convert them into a raster! I just have no idea howi am very confused myself!

enter image description here

enter image description here

I am looking of a way to display different point data as a raster - each point will have a z value.. and i want the raster to be based upon these values (please see my terrible drawing!). I think that using Zonal Geometry is the way to do this - but the problem is that i need each value to be weighted differently. E.g. if the z value of a point is -24, and the z value of the next point is -20, then the area around the -24 point should be larger than the area around the -20 point based on some rules i have been given.

Is this something i will have to try and script? Or is there a way of doing it within the GIS? I am running ArcMap 9.3.1. and would definitely rather avoid scripting!

EDIT Obviously i wasnt very clear!! The points of different colours represent points with the same Z values. What i want is for them to be buffered to a distance which is dependant on their Z value. So if the z-value of a point is -20, and the point next to it is -24, i want to point with a -24 z-value to be buffered by 2/3rds of the distance between it and the -20 point! Its quite difficult to explain.. The rules i have been givern govern how much space each buffer should take up (2/3rds, 1/2, etc!) So as i gather it i would be interpolating between points of equal Z-values - but the amount of space they take up would be goverened by the z-values themselves! Confusing!

The buffering rules i have been given are like this: If the z-value of one point is -20, and the z value of the point next to it is -24, then the point with the -24 zvalue will take up 2/3rds of the space between the 2 points. If both points are equal to -20 then each buffer will take up 1/2 of the space between the 2 points. Here is another crudely drawn picture to try and explain!

EDIT I have posted my question on the ESRI forums in a different wording http://forums.arcgis.com/threads/29731-Weighted-buffering-solution!?p=99414#post99414 I think my solution is to make buffers then to convert them into a raster! I just have no idea how!

enter image description here

enter image description here

I am completely re-writing my question as i think it was quite confusing before:

I have a number of different points, each point has a -z value. I need to create some sort of raster or a series of polygons which buffers these points.. but i have a few complicated rules!

  1. If the adjacent points are of the same z value then the buffer must merge into one polygon.
  2. if the adjacent point is a different z value - then the buffers must be weighted in accordance to the depth of the z values, i.e. if one z-value is -10, and the other is -5, then the buffer of the -10 point will take up 75% of the distance between the 2 points. But because there are many points, and they are all related, this buffering will be different on different sides of the point, see diagram!![enter image description here][1] [1]: https://i.sstatic.net/Zoo0R.png
  3. The idea of the weighted voronoi diagram has been suggested to me and that would be perfect if it weren't for all of the points being related to all of the points around its!
  4. I know how i would do it on paper - i would divide the space between all points by 10, and then based on the difference between the two points choose where the buffer would start (if there is no difference between the points then the buffer starts in the middle).

I am using Arcmap 9.3.1 and am open to python scripting! If you need me to try and explain anything further i will try! i am very confused myself!

added 267 characters in body
Source Link
Alice
  • 417
  • 5
  • 16

I am looking of a way to display different point data as a raster - each point will have a z value.. and i want the raster to be based upon these values (please see my terrible drawing!). I think that using Zonal Geometry is the way to do this - but the problem is that i need each value to be weighted differently. E.g. if the z value of a point is -24, and the z value of the next point is -20, then the area around the -24 point should be larger than the area around the -20 point based on some rules i have been given.

Is this something i will have to try and script? Or is there a way of doing it within the GIS? I am running ArcMap 9.3.1. and would definitely rather avoid scripting!

EDIT Obviously i wasnt very clear!! The points of different colours represent points with the same Z values. What i want is for them to be buffered to a distance which is dependant on their Z value. So if the z-value of a point is -20, and the point next to it is -24, i want to point with a -24 z-value to be buffered by 2/3rds of the distance between it and the -20 point! Its quite difficult to explain.. The rules i have been givern govern how much space each buffer should take up (2/3rds, 1/2, etc!) So as i gather it i would be interpolating between points of equal Z-values - but the amount of space they take up would be goverened by the z-values themselves! Confusing!

The buffering rules i have been given are like this: If the z-value of one point is -20, and the z value of the point next to it is -24, then the point with the -24 zvalue will take up 2/3rds of the space between the 2 points. If both points are equal to -20 then each buffer will take up 1/2 of the space between the 2 points. Here is another crudely drawn picture to try and explain!

EDIT I have posted my question on the ESRI forums in a different wording http://forums.arcgis.com/threads/29731-Weighted-buffering-solution!?p=99414#post99414 I think my solution is to make buffers then to convert them into a raster! I just have no idea how!

enter image description here

enter image description here

I am looking of a way to display different point data as a raster - each point will have a z value.. and i want the raster to be based upon these values (please see my terrible drawing!). I think that using Zonal Geometry is the way to do this - but the problem is that i need each value to be weighted differently. E.g. if the z value of a point is -24, and the z value of the next point is -20, then the area around the -24 point should be larger than the area around the -20 point based on some rules i have been given.

Is this something i will have to try and script? Or is there a way of doing it within the GIS? I am running ArcMap 9.3.1. and would definitely rather avoid scripting!

EDIT Obviously i wasnt very clear!! The points of different colours represent points with the same Z values. What i want is for them to be buffered to a distance which is dependant on their Z value. So if the z-value of a point is -20, and the point next to it is -24, i want to point with a -24 z-value to be buffered by 2/3rds of the distance between it and the -20 point! Its quite difficult to explain.. The rules i have been givern govern how much space each buffer should take up (2/3rds, 1/2, etc!) So as i gather it i would be interpolating between points of equal Z-values - but the amount of space they take up would be goverened by the z-values themselves! Confusing!

The buffering rules i have been given are like this: If the z-value of one point is -20, and the z value of the point next to it is -24, then the point with the -24 zvalue will take up 2/3rds of the space between the 2 points. If both points are equal to -20 then each buffer will take up 1/2 of the space between the 2 points. Here is another crudely drawn picture to try and explain!

enter image description here

enter image description here

I am looking of a way to display different point data as a raster - each point will have a z value.. and i want the raster to be based upon these values (please see my terrible drawing!). I think that using Zonal Geometry is the way to do this - but the problem is that i need each value to be weighted differently. E.g. if the z value of a point is -24, and the z value of the next point is -20, then the area around the -24 point should be larger than the area around the -20 point based on some rules i have been given.

Is this something i will have to try and script? Or is there a way of doing it within the GIS? I am running ArcMap 9.3.1. and would definitely rather avoid scripting!

EDIT Obviously i wasnt very clear!! The points of different colours represent points with the same Z values. What i want is for them to be buffered to a distance which is dependant on their Z value. So if the z-value of a point is -20, and the point next to it is -24, i want to point with a -24 z-value to be buffered by 2/3rds of the distance between it and the -20 point! Its quite difficult to explain.. The rules i have been givern govern how much space each buffer should take up (2/3rds, 1/2, etc!) So as i gather it i would be interpolating between points of equal Z-values - but the amount of space they take up would be goverened by the z-values themselves! Confusing!

The buffering rules i have been given are like this: If the z-value of one point is -20, and the z value of the point next to it is -24, then the point with the -24 zvalue will take up 2/3rds of the space between the 2 points. If both points are equal to -20 then each buffer will take up 1/2 of the space between the 2 points. Here is another crudely drawn picture to try and explain!

EDIT I have posted my question on the ESRI forums in a different wording http://forums.arcgis.com/threads/29731-Weighted-buffering-solution!?p=99414#post99414 I think my solution is to make buffers then to convert them into a raster! I just have no idea how!

enter image description here

enter image description here

added 465 characters in body
Source Link
Alice
  • 417
  • 5
  • 16
Loading
added 515 characters in body; added 173 characters in body
Source Link
Alice
  • 417
  • 5
  • 16
Loading
fix typo
Source Link
scw
  • 16.4k
  • 6
  • 65
  • 101
Loading
Tweeted twitter.com/#!/StackGIS/status/65025607418920960
Source Link
Alice
  • 417
  • 5
  • 16
Loading