6

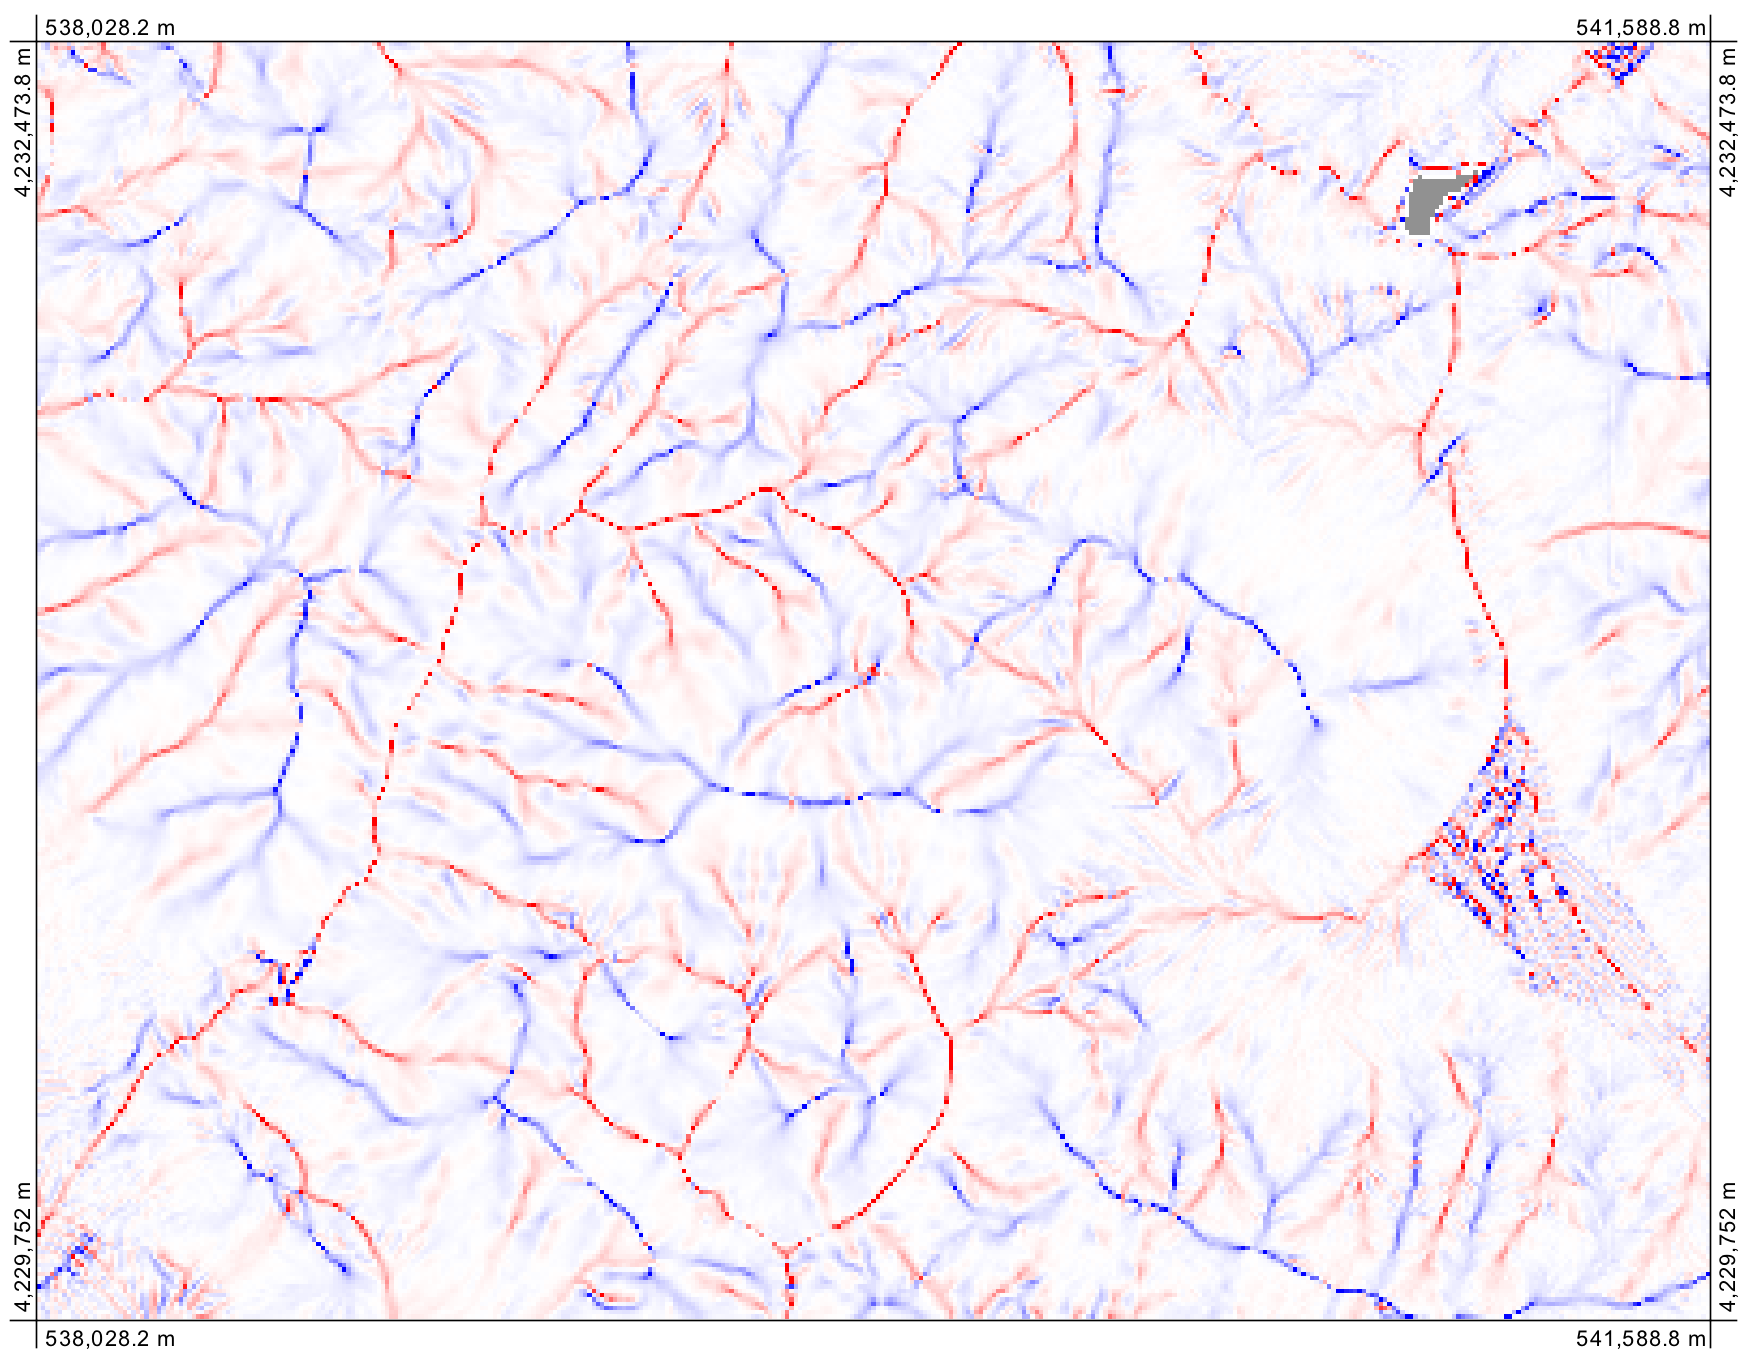
I've been struggling with this problem for awhile. Here is a curvature raster to illustrate the problem.
I'm using 10m DEM rasters from the NRCS Data Gateway for a large portion of California. The problem is some strange tiling that appears after merging, but isn't present in the original data (before merging). The grids create low points, so flow accumulation etc is drawn into them.

I've tried mosaic to new raster, create raster catalog and filter in ArcGIS 10.2, merge and build vrt in Qgis2.4 but the problem persists throughout.

Something to note is that there are apparently two sets of grids, one with regular equant shapes, and then one set where tiles overlap (on both edges of the tile). I discovered this with "build raster catalog" which creates a feature displaying the edges of the files in the catalog.

The lines are flat lows, which creates a problem trying to do any sort of slope stability or hydrologic analysis...which is the whole point of this exercise.


use BILINEAR interpolation (in environment settings) for DEM, these grids are caused by the default nearest neighbor interpolation.

6
  • When you say low points, are they -9999 or -32768 by chance? Are they actually NoData values but haven't been set as such, so that the mosaicking isn't ignoring these missing columns/rows in the way that it should be? Commented Oct 20, 2014 at 22:51
  • Can you upload two such tiles somewhere for us to play around with? Commented Oct 20, 2014 at 22:51
  • Are you merging original DEMs or processed, .e.g. individual flow accumaulation grids?
    – FelixIP
    Commented Oct 20, 2014 at 22:53
  • no they aren't NoData values, but they are 1 pixel wide and lower elevation than either pixel on the right and left.
    – Rocksyeaa
    Commented Oct 20, 2014 at 22:59
  • I can probably help you to solve the problem, but only if you can find somewhere that you can upload two of the tiles and provide a link in the answer. Otherwise, it would be very difficult to diagnose the problem since there can be so many different causes for this type of phenomenon. Commented Oct 20, 2014 at 23:04

1 Answer 1

8

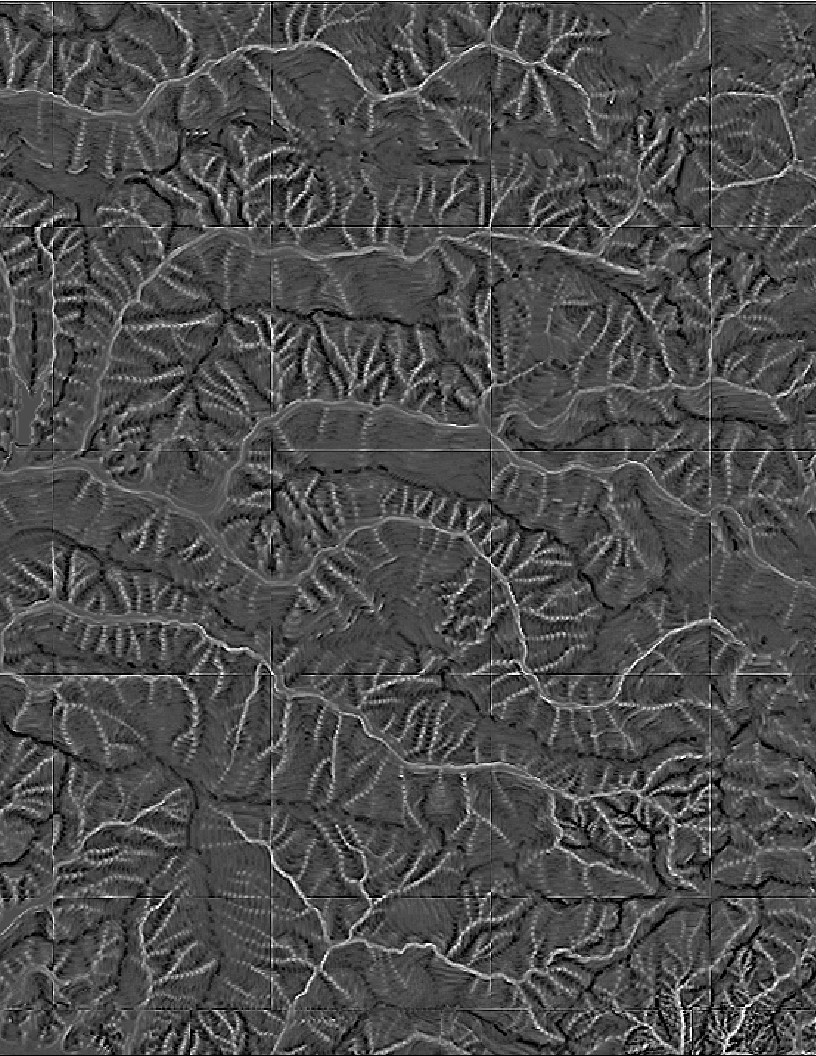
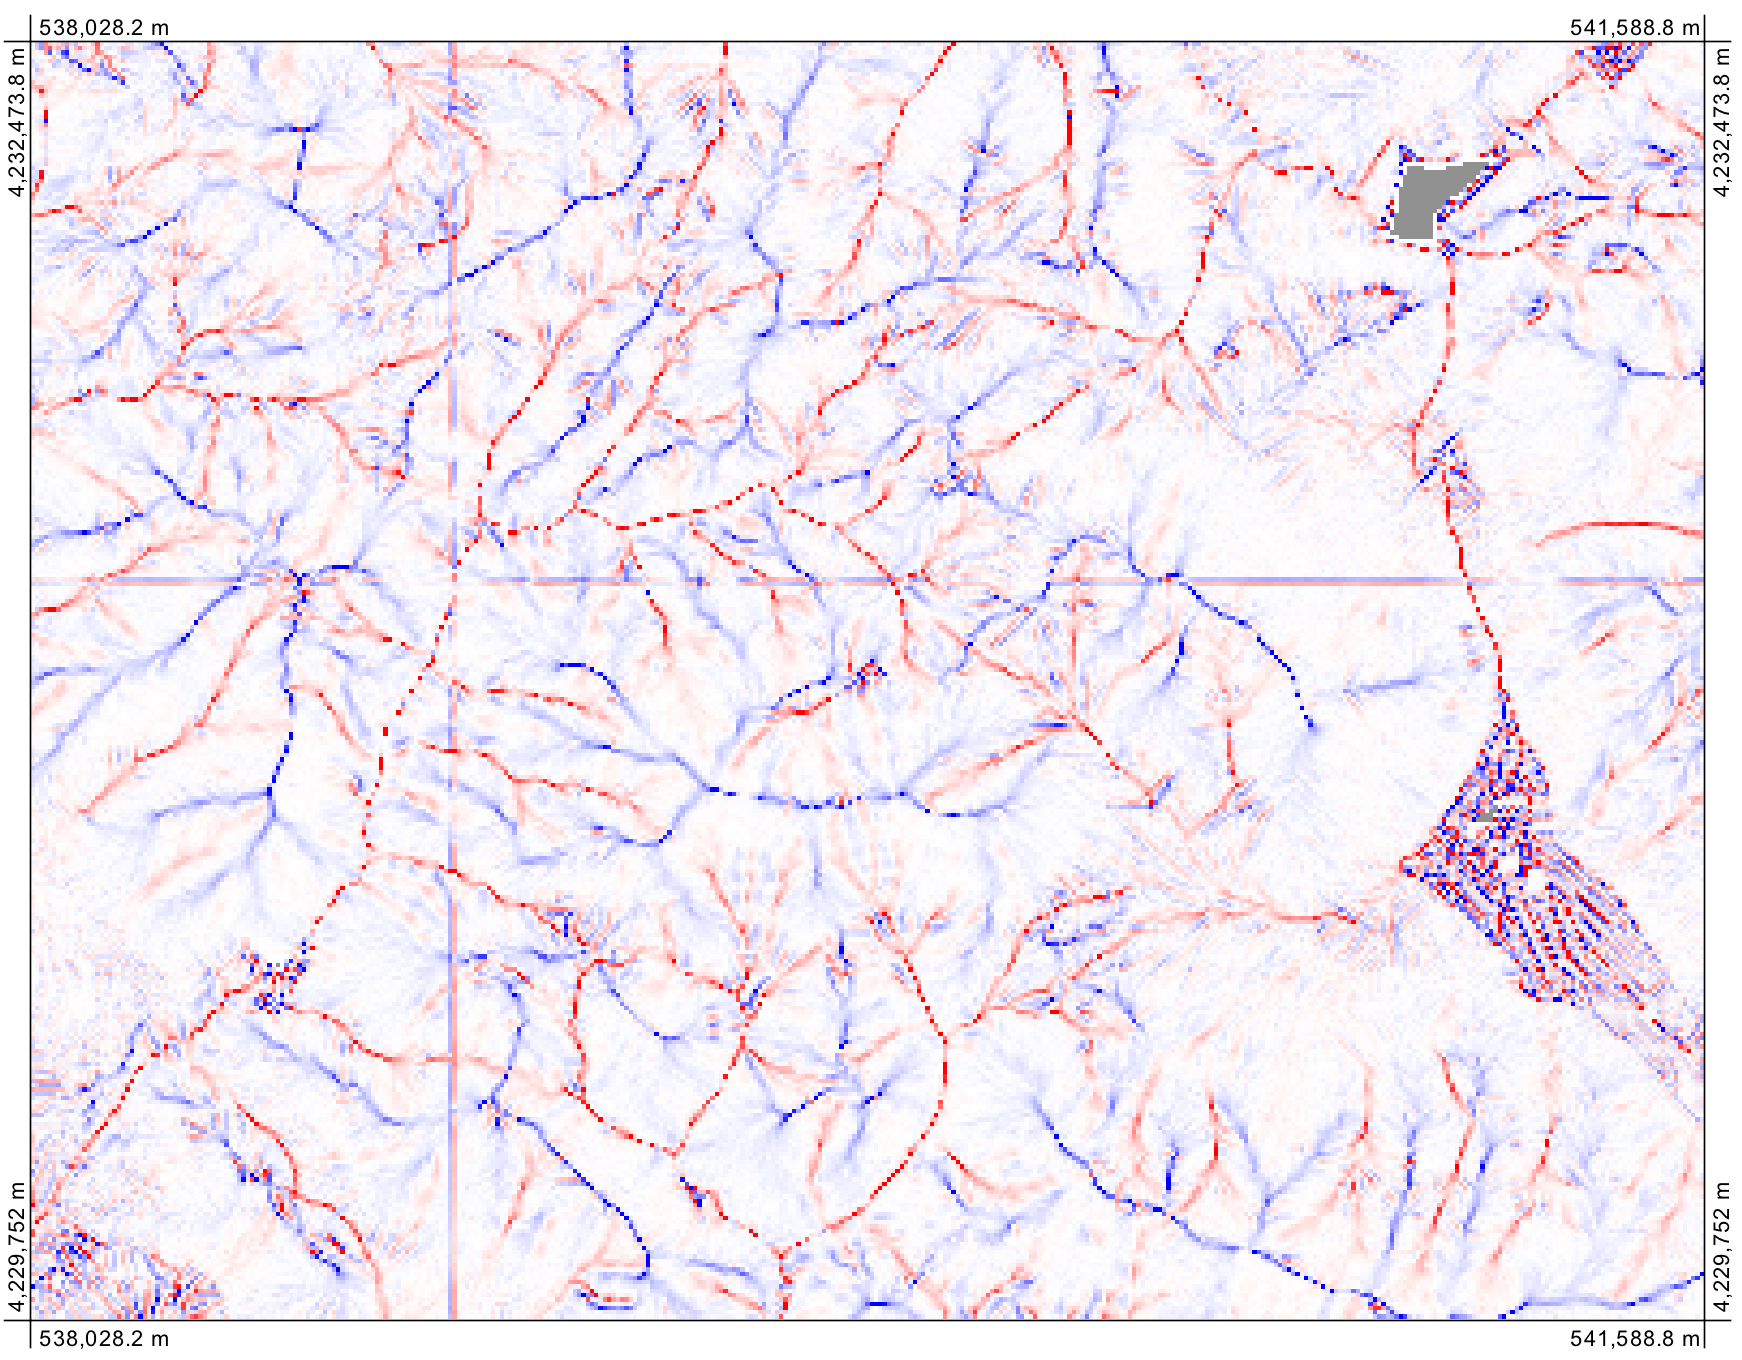
This was a tough problem to track down because I had thought that the effect was at the edges of tiles when it fact they are throughout the data. You're right that the phenomena isn't in the data before mosaicking the data. The problem results from the resampling process that is inherent in mosaicking. You need to use either the cubic convolution or bilinear resampling methods when you mosaic your DEM tiles instead of the default nearest-neighbour resampling method. The phenomenon is the result of duplicated rows and columns of values during the nearest-neighbour resampling. The following is an example of a plan curvature image derived from the mosaicked tiles you provided using nearest-neighbour:

enter image description here

It displays the same phenomenon that you describe in the question. Nearest-neighbour resampling is most suited to applications with categorical data while continuous data, such as elevation, is better resampled using bilinear or CC resampling methods. Here is the same data after mosaicking the data using cubic convolution:

enter image description here

Beware, however, that bilinear resampling and cubic convolution will result in a slight smoothing of the topography (bilinear slightly less than CC).

6
  • Good spot, generally Nearest for nominal datasets and cubic or bilinear for ratio datasets. Not always but a good rule-of-thumb. Commented Oct 21, 2014 at 2:48
  • So I see another problem, more grids representing flat lows in the curvature raster on the merged edges of the DEM rasters. (I'll use the same DEM examples linked above) This is the unmerged DEM raster This is a curvature raster with bilinear resampling on the original mosaic. Note that those lines are the edges of BOTH of the mosaiced DEM, creating 2 lines.
    – Rocksyeaa
    Commented Oct 22, 2014 at 18:09
  • @Rocksyeaa Another problem is another question. I'll need more details on the new problem to be able to answer it, which is probably best to provide in a separate question. I assume that the bilinear interpolation solved most of the line artifacts that you had in the original post? You'll need to describe this new artifact a little more. Where does it occur? In which raster? Is it in the curvature image derived from the mosaic? Is it along the edges of the composite images in the mosaic? Commented Oct 22, 2014 at 18:20
  • Yep. along the composite edges in the mosaic, and biliner interpolation DID solve the original grid problem, and this is another artifact. Unmosaiced: imgur.com/e2AoQYc Mosaiced biliner and generated curvature: imgur.com/avdNQYY
    – Rocksyeaa
    Commented Oct 22, 2014 at 18:24
  • New question: gis.stackexchange.com/questions/119350/…
    – Rocksyeaa
    Commented Oct 22, 2014 at 18:33

Your Answer

By clicking “Post Your Answer”, you agree to our terms of service and acknowledge you have read our privacy policy.

Not the answer you're looking for? Browse other questions tagged or ask your own question.