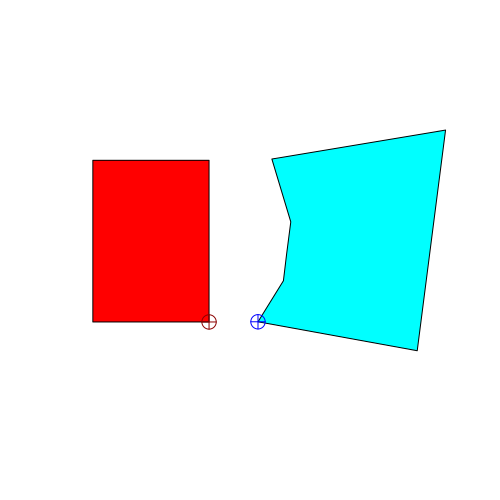
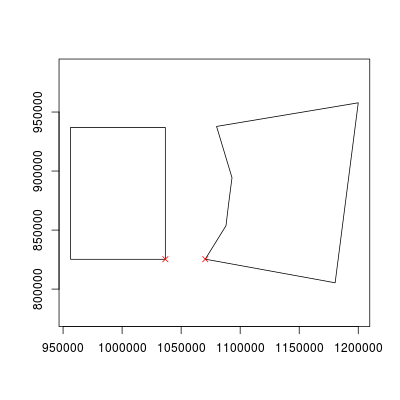
When the vertices from a polygon are the closest points from another polygon you can use the Answer 1 example. However, sometimes may occur that a line segment from one polygon is the closest part of a polygon from another polygon. In that case, you can use the Answer 2 example. It compares all the vertices from one polygon against all possible line segments from the other polygon and viceversa. It takes the minimum distance and positions using the function dist2Line from the R package geosphere.
# Load libraries ----------------------------------------------------------

# Libraries for GIS
library('raster')
library('rgeos')
library('geosphere')

# Libraries for plots
library('latticeExtra')
library('RColorBrewer')

# Load data ---------------------------------------------------------------

# Extent rectangle
rect <- as(extent(956328.8, 1036613, 825238.9, 936911.5), "SpatialPolygons")

# Lake polygon
x <- c(1199999, 1080000, 1093067, 1090190, 1087977, 1070419, 1180419)
y <- c(957803.6,937803.6, 894366.9, 872153.9, 853703.0, 825353.6, 805353.6)
poly.lake <- SpatialPolygons(list(Polygons(list(Polygon(data.frame(x,y))), ID = 1)))
Answer 1
This example work only for polygon vertices
# Get coordinates from polygons -------------------------------------------

lake.points <- SpatialPoints(coords = poly.lake@polygons[[1]]@Polygons[[1]]@coords)
rect.points <- SpatialPoints(coords = rect@polygons[[1]]@Polygons[[1]]@coords)

# Measure distances between SpatialPoints objects
rect.dist <- gDistance(rect.points, lake.points, byid = TRUE)

# Minimum distance
minDist <- rect.dist[which(rect.dist == min(rect.dist))]

# Coordinates of min distance
mCoord <- as.data.frame(which(rect.dist == minDist, arr.ind=TRUE))

# Get coordinates of closest points ---------------------------------------

# The points from lake polygons are the rows in the "rect.dist" matrix
# The points from rect polygons are the columns in the "rect.dist" matrix

# Coordinates of the closest point from poly.lake
coordsClosestPointPolyLake <- coordinates(lake.points[mCoord$row,])

# Coordinates of the closest point from poly.rect
coordsClosestPointPolyRect <- coordinates(rect.points[mCoord$col,])

# Plot of polygons and closest points
plot(rect, xlim = c(extent(rect)[1], extent(poly.lake)[2]), ylim = extent(poly.lake)[3:4], col = "red")
plot(poly.lake, col = "cyan", add = TRUE)
plot(lake.points[mCoord$row,], col = "blue", pch = 10, cex = 2, add = TRUE)
plot(rect.points[mCoord$col,], col = "darkred", pch = 10, cex = 2, add = TRUE)

Answer 2
This example work for vertices and also when some line segment from a polygon is closer (to the other polygon) than their vertices
# Define projection (this projection is an example, I don't know what projection the original data apply to)
projExample <- "+proj=utm +zone=50 +north +ellps=WGS84 +datum=WGS84 +units=m +no_defs"

# Get coordinates of each polygon and transform to SpatialPoints object
lake.points <- SpatialPoints(coords = poly.lake@polygons[[1]]@Polygons[[1]]@coords, proj4string = CRS(projExample))
rect.points <- SpatialPoints(coords = rect@polygons[[1]]@Polygons[[1]]@coords, proj4string = CRS(projExample))

# Make SpatialLinesDataFrame objects --------------------------------------

# Make SpatialLines objects - line segments - from points (SpatialPoints objects)

# Lake
lake.lines <- list()

for(i in 1:(length(lake.points) - 1)) {

  lake.lines[[i]] <- Lines(slinelist = Line(coords = coordinates(lake.points[c(i, i + 1)])), ID = paste(i))

  }

lake.lines <- SpatialLinesDataFrame(sl = SpatialLines(lake.lines, proj4string = CRS(projExample)), data = data.frame("ID" = paste(1:(length(lake.points) - 1))), match.ID = TRUE)

# Rect
rect.lines <- list()

for(i in 1:(length(rect.points) - 1)) {

  rect.lines[[i]] <- Lines(slinelist = Line(coords = coordinates(rect.points[c(i, i + 1)])), ID = paste(i))

  }

rect.lines <- SpatialLinesDataFrame(sl = SpatialLines(rect.lines, proj4string = CRS(projExample)), data = data.frame("ID" = paste(1:(length(rect.points) - 1))), match.ID = TRUE)

# Plots -------------------------------------------------------------------

# Plot line segments

# (optional: only a margin from spatial objects in the plot)
xOffset <- 30000
yOffset <- 30000

# Main plot
plotRectLines <- spplot(rect.lines, zcol = "ID", lwd = 2, col.regions = RColorBrewer::brewer.pal(4, "Dark2"), xlim = c(extent(rect)[1] - xOffset, extent(poly.lake)[2] + xOffset), ylim = c(extent(poly.lake)[3] - yOffset, extent(poly.lake)[4] + yOffset), colorkey = FALSE)

# Spatial layers to add to the plot
layerLakeLines <- layer(sp.lines(lake.lines, zcol = "ID", lwd = 2, col = brewer.pal(7, "Accent")))
layerRectLinesLabels <- layer(sp.text(coordinates(getSpatialLinesMidPoints(rect.lines)), txt = as.character(rect.lines$ID)))
layerLakeLinesLabels <- layer(sp.text(coordinates(getSpatialLinesMidPoints(lake.lines)), txt = as.character(lake.lines$ID)))

# Run Main plot + layers
plotRectLines + layerLakeLines + layerRectLinesLabels + layerLakeLinesLabels

# Calculate distances between vertices and lines --------------------------

# First: transform coordinates to WGS84 (lon lat) when using function dist2Line
# The dist2Line function calculate the minimum distance between points and lines and also return the closest position from the line where the minimum distance was measured.

# Distances between points from "rect" and lines from "lake"
distRect2Lake <- dist2Line(p = spTransform(rect.points, CRSobj = CRS("+proj=longlat +datum=WGS84")), line = spTransform(lake.lines, CRSobj = CRS("+proj=longlat +datum=WGS84")))

# Convert to data frame
distRect2Lake <- as.data.frame(distRect2Lake)

# Add reference category (where positions belongs to)
distRect2Lake$object <- rep("lake", nrow(distRect2Lake))

# Distances between points from "lake" and lines from "rect"
distLake2Rect <- dist2Line(p = spTransform(lake.points, CRSobj = CRS("+proj=longlat +datum=WGS84")), line = spTransform(rect.lines, CRSobj = CRS("+proj=longlat +datum=WGS84")))

# Convert to data frame
distLake2Rect <- as.data.frame(distLake2Rect)

# Add reference category (where positions belongs to)
distLake2Rect$object <- rep("rect", nrow(distLake2Rect))

# Merge data frames distances
mergeDistances <- as.data.frame(rbind(distRect2Lake, distLake2Rect))

# Minimum distances -------------------------------------------------------

# Query minimum distances from mergeDistances data frame
minDistRows <- which(mergeDistances$distance == min(mergeDistances$distance))

# Extract closest points from mergeDistances data frame
closestPoints <- mergeDistances[minDistRows,]

# Transform closest points to SpatialPointsDataFrame object
closestPointsSPDF <- SpatialPointsDataFrame(coords = closestPoints[,2:3], data = closestPoints[,-c(2:3)], proj4string = CRS("+proj=longlat +datum=WGS84"))

# Project to original projection (UTM Zone 50N)
# Remember: this projection is arbitrary.
closestPointsSPDF <- spTransform(x = closestPointsSPDF, CRSobj = CRS(projExample))

# ---> Here is the answer to this question <---
# ---> coordinates of the closest points <---
(coordinates(closestPointsSPDF))

# Final plot --------------------------------------------------------------

# Make layers from closest points
layerClosestPointFromRect <- layer(sp.points(obj = closestPointsSPDF[closestPointsSPDF$object == "rect", ], pch = 10, cex = 2, col = "red", lwd = 2))
layerClosestPointFromLake <- layer(sp.points(obj = closestPointsSPDF[closestPointsSPDF$object == "lake", ], pch = 10, cex = 2, col = "blue", lwd = 2))

# Plot results
plotRectLines + layerLakeLines + layerRectLinesLabels + layerLakeLinesLabels + layerClosestPointFromRect + layerClosestPointFromLake

Note: every line segment of the polygon is labeled and the closest point from the rect and lake polygons in red and blue respectively.


extentfunction? I guess fromraster? I also see that function ingazetools...rectconsists of more than one polygon?