0

I am trying to classify agricultural fields with randomForest model. I will conduct an object-based classification. To do so, in the code by Ned Horning, I provide the boundaries in a shapefile. The code extracts pixels from this area and calculates the measures such as mean of the included pixel values and std of those values. In this case the followings are my predictors:

  • mean_Red_Band of an object (such as a field)
  • mean_NDVI_Band of an object
  • std_Red_Band of an object
  • and etc.

My observations in this case are the polygons that I provided as shapefile, i.e. 3600 fields.

I have no problem with the code but the concept. My question is: can I include a unique GLCM measure of an object as a predictor in the model?

Here is a detailed explaination of my problem:

Suppose that I have an object image as this: https://i.sstatic.net/vrTjP.jpg

When I calculated the GLCM measures for the object here is different GLCM images for different measures: https://i.sstatic.net/FGFCt.jpg

Specifically, a GLCM contrast image is as this: https://i.sstatic.net/XmNNz.jpg

It calculates it with the following code in R:

glcm <- glcm(rasterobject, 
                   window = c(9,9), ## window matrix size ##
                   shift = list(c(0,1), c(1,1), c(1,0), c(1,-1)), ## matrix direction ##
                   statistics = c("mean", "variance", "homogeneity", "contrast", 
                                  "dissimilarity", "entropy", "second_moment") ##statistics##
      )

What is told about using GLCM measures is that you can use it to understand texture differences in an image. In my example, you can check the glcm_contrast image and understand the texture of the object.

However, I have multiple objects. For example, my second object and its glcm measures as follows:

https://i.sstatic.net/7LRwU.jpg

https://i.sstatic.net/6TgVT.jpg

https://i.sstatic.net/rh0NQ.jpg

As you can see GLCM measures are calculated for different objects. If we wanted like to see this objects as a matrix, we would see a matrix like this: (It is the a part of the matrix of object2_glcm_contrast https://i.sstatic.net/rh0NQ.jpg):

A part of the matrix: https://i.sstatic.net/9uiei.jpg

The GLCM measures are calculated and written to mid-pixel of the matrix by nrow=9 and ncol=9, thus there are multiple glcm values of an object.

My question is can I calculate a unique GLCM measure for an object? If I can so, I would be able to put it as a predictor variable of an observation, which is an object.

A unique GLCM measure could be this, for example:

glcm_contrast_mean <- sum(as.matrix(glcm$glcm_contrast),
                                na.rm = TRUE)/(length(as.matrix(glcm$glcm_contrast))
                                               - sum(is.na(as.matrix(glcm$glcm_contrast))))

And it is:

> glcm_contrast_mean
[1] 2.759012

This value is only for an object whereas, on above, there are multiple values for different parts of an object.

Could this measure (or any other) represent the object's texture?

2
  • Could you please focus this question? I currently see two questions. Could you please expand on what you mean in the second question too please?
    – Aaron
    Commented Jun 3, 2019 at 21:36
  • Hi, I tried to elaborate it. I hope it is clear though I can feel it isn't. I did my best to explain but I'll check and edit it again after your feedback. Commented Jun 4, 2019 at 11:47

1 Answer 1

3

Short answer: Yes, you can use GLCM in RF classification. If you want to implement an OBIA analysis in R, you need to create a DF where each row is an object. Also, the final predict is applied over a df. To create this df object, use extract() function using your polygons.

Long answer: implementation of RF classification using GLCM as predictor (in this case I used all the layers as predictors, just for exampling purpose):

# packages used in this example
library(RStoolbox)
library(glcm)
library(raster)
library(rgeos)
library(caret)

# example Landsat file
mtlFile  <- system.file("external/landsat/LT52240631988227CUB02_MTL.txt", 
                        package="RStoolbox")
metaData <- readMeta(mtlFile)

lsat     <- stackMeta(mtlFile)

lsat_ref <- radCor(lsat, metaData = metaData, method = "apref")

# create polygons to extract train samples
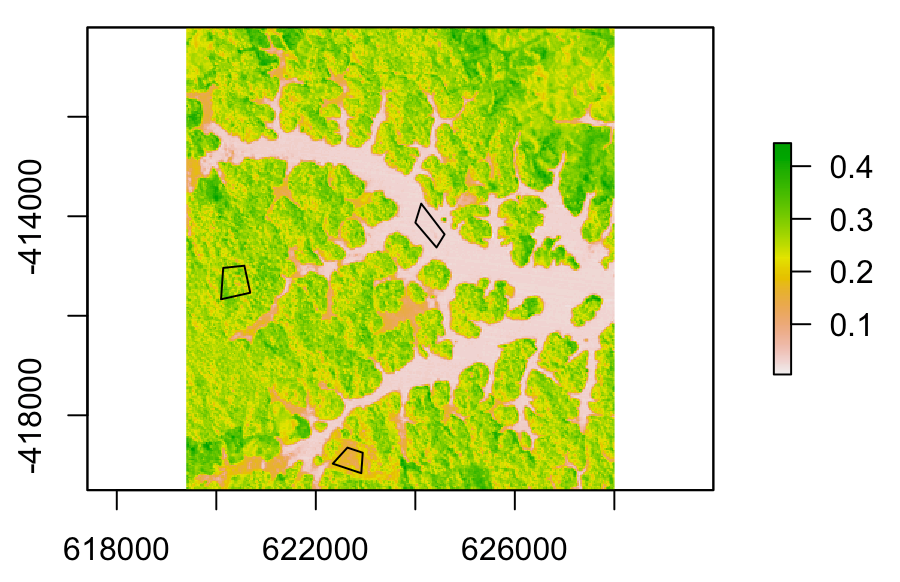
p1 <- readWKT('POLYGON ((622341 -418973, 622635 -418650, 622943 -418753, 622914 -419164, 622341 -418973))')
p2 <- readWKT('POLYGON ((620095 -415669, 620139 -415038, 620564 -414994, 620682 -415537, 620095 -415669))')
p3 <- readWKT('POLYGON ((624426 -414627, 624001 -414128, 624118 -413746, 624588 -414363, 624426 -414627))')

poly <- SpatialPolygonsDataFrame(union(union(p1,p2),p3), data = data.frame(ID = 1:3))
crs(poly) <- lsat_ref@crs

plot(lsat_ref[[4]])
plot(poly, add = T)

enter image description here

# compute GLCM
lsat_glcm <- glcm(lsat_ref[[4]], 
                  window = c(9,9), 
                  shift = list(c(0,1), c(1,1), c(1,0), c(1,-1)), 
                  statistics = c("mean", "variance", "homogeneity", "contrast", 
                                 "dissimilarity", "entropy", "second_moment"))

# stack layers to landsat image
s <- stack(lsat_ref,lsat_glcm)

# extract samples
df <- extract(s, poly, df = T)

# Use ID field as "class" response, could be other field also
df$ID <- as.factor(df$ID)

# Check min sample size
table(df[,1])

# define sample size value, use some for train and the other to train
ss <- round(min(table(df[,1]))*0.7)

classes <- unique(df[,1])

classes <- classes[order(classes)]

l <- list()

# extract samples randomly
for (i in seq_along(classes)) {
  temp <- which(df[,1] == classes[i])
  l[[i]] <- sample(temp, ss)
}

train_ <- df[unlist(l),]
test_ <- df[-unlist(l),]


control <- trainControl(method = "repeatedcv", number = 10, repeats = 3, search = "grid", allowParallel = TRUE)

# create a tune grid used in Caret to optmize model accuracy
tunegrid <- expand.grid(.mtry = (1:5)) 

# train the model, ID used as response (you can use your class field)
model <- train(ID~., data = train_, method = "rf", metric = "Kappa", tuneGrid = tunegrid, trControl = control, preProcess = c('center','scale'), verbose = FALSE, trace = FALSE)

# predict over test data
test_app <- predict(model, newdata = test_[,-1], 'raw')

# confusion matrix
table(test_[,1],test_app)
##    test_app
##       1   2   3
##   1  61   0   0
##   2   0 188   0
##   3   0   0 103

# predict over the raster object
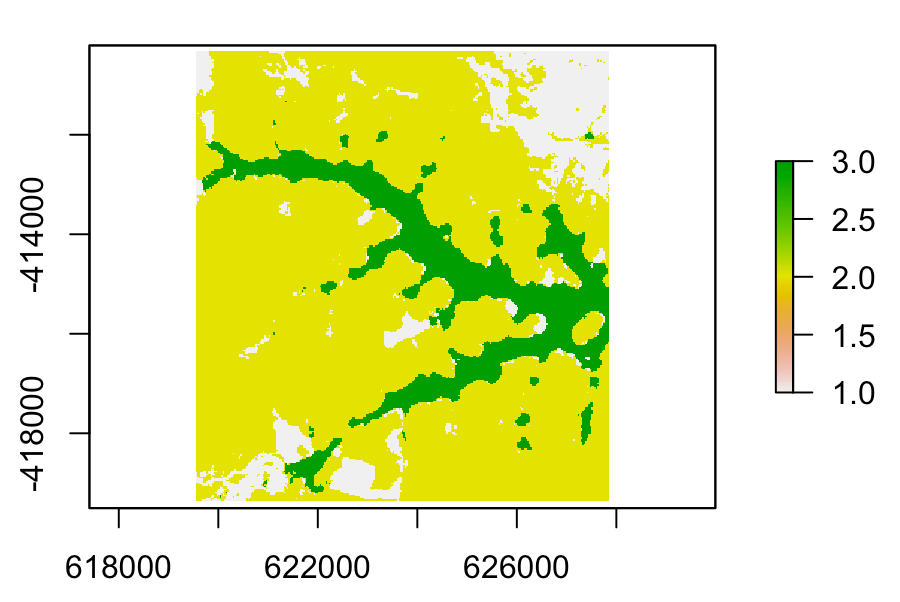
rclass <- predict(s,model)

# plot results
plot(rclass)

enter image description here

This is a pixel-by-pixel approach. You can use the same code in an object-based approach.

Note: results aren't the best. This was made for show the code only

5
  • Thanks! My question was more conceptual but the code solved my another pain. Here is the template I use for the modeling by Ned Horning: github.com/nedhorning/RandomForestForRemoteSensing/tree/master/… I was calculating GLCM after I extracted polygons but doing it before extraction makes perfect sense! In the code, you can find how to extract values from rasterized polygons. It is really fast in comparison to extraction from vectors Commented Jun 4, 2019 at 13:58
  • Ned uses OTB for segmentation. Considering MeanShift segmentation, be aware of the usage of mean response of each polygon. I would suggest the use of median instead mean, especially if you'll use Sentinel-2 scenes
    – aldo_tapia
    Commented Jun 4, 2019 at 14:05
  • We are using Planet images which has 3x3m resolution. If you may give some useful resources about meanshift, it would be perfect. We found OTB's mean shift method the best but couldn't understand how it really does this segmentation. I also performed Noel Gorelick's GEE code editor example to get the boundaries of the image. (by SNIC algorithm) It was promising too. If you are interested, we can talk further in private about the project and our work. Commented Jun 4, 2019 at 14:15
  • I sent you a request on LinkedIn. I hope you are interested. It is about both GIS and agriculture. Commented Jun 4, 2019 at 14:24
  • Yes, could be interesting. I've worked in image segmentation with OTB, eCognition and ArcGIS PRO, where eCognition gives the best result. Check this thread: gis.stackexchange.com/a/261620/80215 I used this function to iterate parameters and obtain the best set up for my purposes
    – aldo_tapia
    Commented Jun 4, 2019 at 14:24

Your Answer

By clicking “Post Your Answer”, you agree to our terms of service and acknowledge you have read our privacy policy.

Not the answer you're looking for? Browse other questions tagged or ask your own question.