3

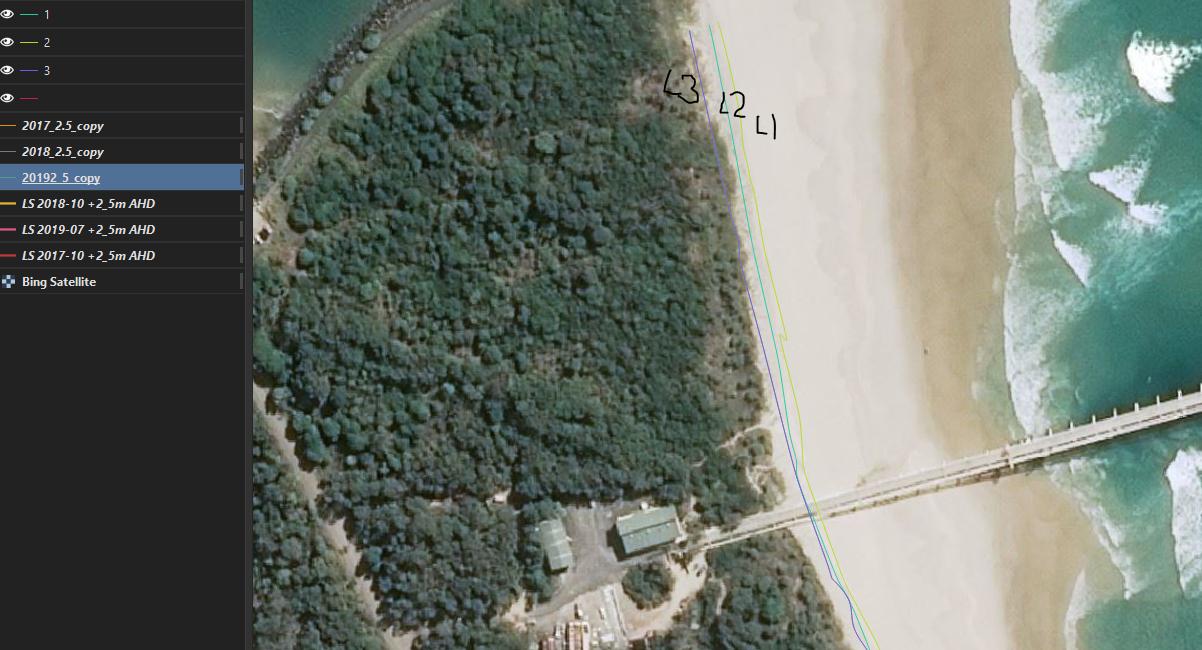
I am trying to set up an animation showing lines which represent erosion contours moving back. Effectively the animation will show 1 whole line then the next line then the next line etc. for about 20 lines.

I've researched the time series and MMQGIS tools but both seem to focus on moving points along a line or a line which extends to its full length.

Is it possible to make a whole line change position again and again in animation.

example

In the animation I want L1 to appear then L2 then L3 etc for about 20 lines

8
  • 2
    Take a look at TimeManager plugin
    – MrXsquared
    Commented Nov 12, 2019 at 23:04
  • I have looked at TimeManager but it dosn't seem to work with lines. I'm guessing that's beacuse a line has multiple co-ordinates rather than just one set as with point data.
    – JohnF
    Commented Nov 12, 2019 at 23:22
  • I think that it must work with lines. You need all lines in a layer with a column for the timestamp. Commented Nov 13, 2019 at 0:44
  • Hi Gabriel, I have a timestamp column with the date in the required format. However when i click on play nothing happens. Do the lines need co-ordinate data added somehow? Thanks for your time
    – JohnF
    Commented Nov 13, 2019 at 1:02
  • 1
    Use the field calculator to add a field with the expression geom_to_wkt($geometry). Make sure the new field is a text field and long enough to hold the longest wkt geometry in your layer. WKT format is explained here: en.wikipedia.org/wiki/…
    – csk
    Commented Nov 14, 2019 at 17:29

0

Your Answer

By clicking “Post Your Answer”, you agree to our terms of service and acknowledge you have read our privacy policy.

Browse other questions tagged or ask your own question.