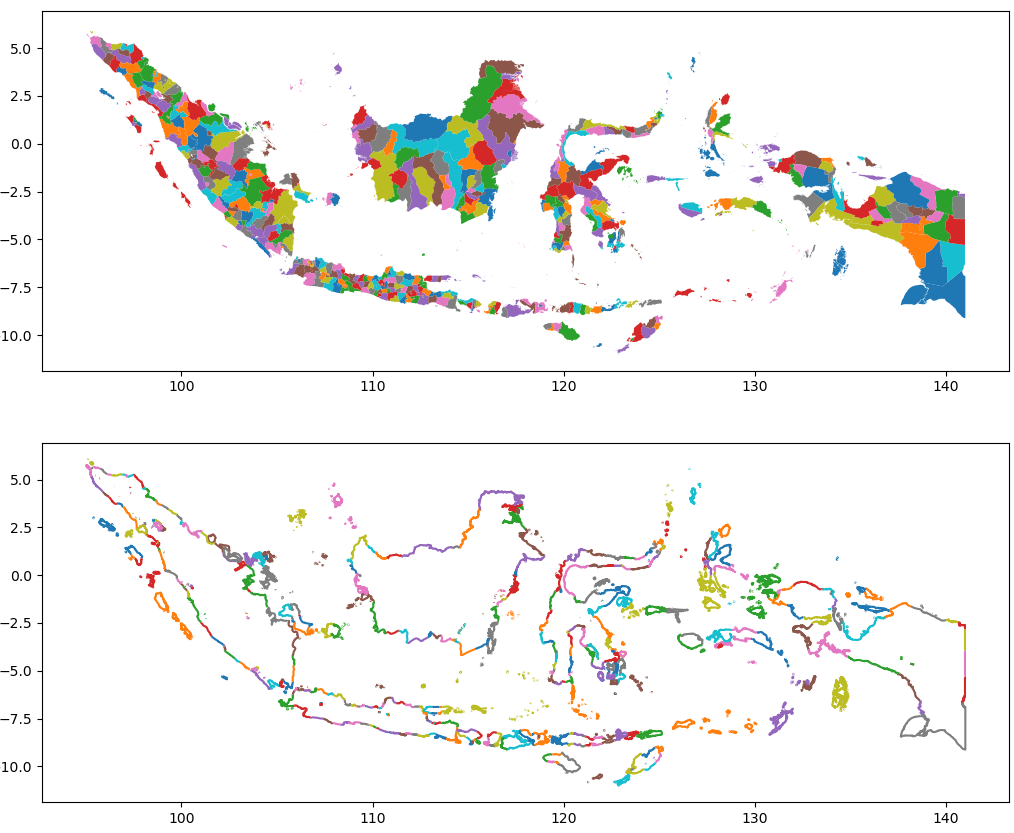
With some overlays, you can take advantage of the fact that the outer boundaries aren't intersecting with any other city boundaries...
The following script shows how. I included some test data in the script and commented your sample dataset so the script stays working if your sample dataset would become unavailable in the future:
import math
import geopandas as gpd
from matplotlib import pyplot as plt
import matplotlib.colors as mcolors
import shapely

# Prepare (test) data.
poly1 = shapely.box(2, 0, 4, 3)
poly2 = shapely.box(0, 1, 2, 2)
cities = gpd.GeoDataFrame(data={"alt_name": ["Brussels", "Ukkel"]}, geometry=[poly1, poly2])
# cities = gpd.read_file("https://gist.githubusercontent.com/bagusindrayana/d42d0806d00fff1e805e733256eb07bf/raw/51e6ac2864c996a83be844fd562056f482d91caf/kota_indonesia.geojson")

# We want to work with the boundaries of the polygons rather than the polygons.
boundaries = cities.copy()
boundaries["geometry"] = cities.geometry.boundary

# We only want to keep the outer boundaries... so the pieces of boundary that don't
# intersect/touch the boundaries of a neighbouring city.
# First determine the pieces of boundary that do intersect with a neighbour.
intersections = boundaries.overlay(boundaries)
# Retain only the boundary intersections with another city.
intersections = intersections.loc[intersections["alt_name_1"] != intersections["alt_name_2"]]
# Now we can use these intersections to remove them from the initial boundaries.
boundaries_outer = boundaries.overlay(intersections, how="difference")

# Plot input + result.
fig, ax = plt.subplots(nrows=2, figsize=(15, 15))
colors = list(mcolors.TABLEAU_COLORS) * math.ceil(len(cities) / len(mcolors.TABLEAU_COLORS))
cities.plot(ax=ax[0], color=colors)
colors = list(mcolors.TABLEAU_COLORS) * math.ceil(len(boundaries_outer) / len(mcolors.TABLEAU_COLORS))
boundaries_outer.plot(ax=ax[1], color=colors)

plt.show()
Result:


