The comments above lead me towards an answer (but if there are other possibilities, please let me know):
gdal can utilise bands containing longitude and latitude values, which is called there geolocation arrays. The answer below may not be thorough and I myself don't understand all the details:
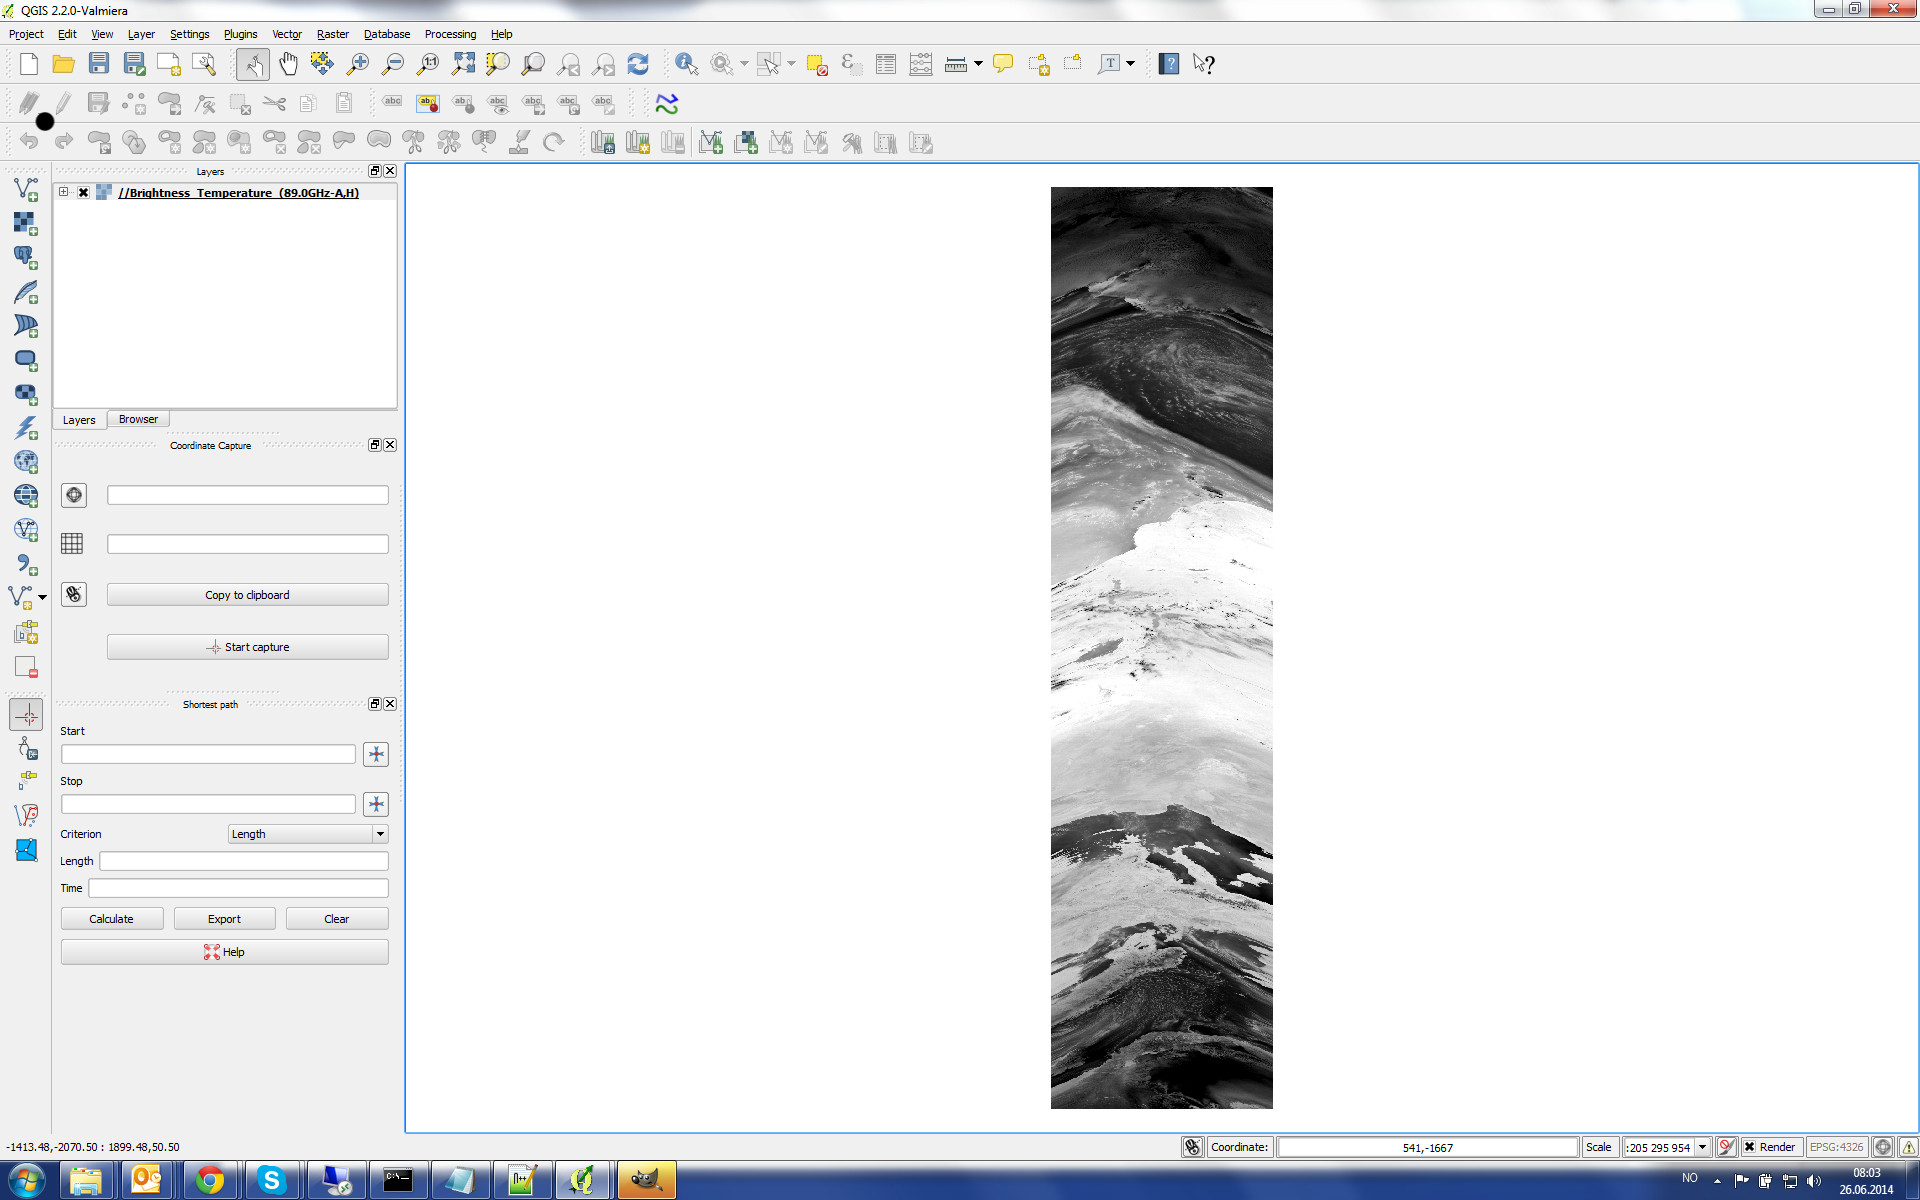
The original image is a orbital swath in a raster (AMSR2 data) and there is a raster band containing latitude and a raster band containing longitude values:

This link tells me that you have to create vrt-files (as described here) describing the image raster, the lat band and the lon band, also connnecting the lat/lon band to the image
So I create one file called GW1AM2_201301311114_050A_L1SGBTBR_1110110.vrt:
<vrtdataset rasterxsize="486" rasterysize="2017">
   <metadata domain="GEOLOCATION">
     <mdi key="X_DATASET">C:\Users\max\Documents\lon.vrt</mdi>
     <mdi key="X_BAND">1</mdi>
     <mdi key="Y_DATASET">C:\Users\max\Documents\lat.vrt</mdi>
     <mdi key="Y_BAND">1</mdi>
     <mdi key="PIXEL_OFFSET">0</mdi>
     <mdi key="LINE_OFFSET">0</mdi>
     <mdi key="PIXEL_STEP">1</mdi>
     <mdi key="LINE_STEP">1</mdi>
   </metadata>
   <vrtrasterband band="1" datatype="UInt16">
   <metadata>
    <simplesource>
      <sourcefilename relativetovrt="1">HDF5:GW1AM2_201301311114_050A_L1SGBTBR_1110110.h5://Brightness_Temperature_(89.0GHz-A,H)</sourcefilename>
      <sourceband>1</sourceband>
      <sourceproperties blockxsize="486" blockysize="1" datatype="UInt16" rasterxsize="417" rasterysize="2017">
      <srcrect xoff="0" xsize="486" yoff="0" ysize="2017">
      <dstrect xoff="0" xsize="486" yoff="0" ysize="2017">
    </dstrect></srcrect></sourceproperties></simplesource>
  </metadata></vrtrasterband>
</vrtdataset>
another file called lon.vrt
<vrtdataset rasterxsize="486" rasterysize="2017">
  <vrtrasterband band="1" datatype="Float32">
    <metadata>
    <simplesource>
      <sourcefilename relativetovrt="1">HDF5:GW1AM2_201301311114_050A_L1SGBTBR_1110110.h5://Longitude_of_Observation_Point_for_89A</sourcefilename>
      <sourceband>1</sourceband>
      <sourceproperties blockxsize="486" blockysize="1" datatype="Float32" rasterxsize="486" rasterysize="2017">
      <srcrect xoff="0" xsize="486" yoff="0" ysize="2017">
      <dstrect xoff="0" xsize="486" yoff="0" ysize="2017">
    </dstrect></srcrect></sourceproperties></simplesource>
  </metadata></vrtrasterband>
</vrtdataset>
and a file called lat.vrt
<vrtdataset rasterxsize="486" rasterysize="2017">
  <vrtrasterband band="1" datatype="Float32">
    <metadata>
    <simplesource>
      <sourcefilename relativetovrt="1">HDF5:GW1AM2_201301311114_050A_L1SGBTBR_1110110.h5://Latitude_of_Observation_Point_for_89A</sourcefilename>
      <sourceband>1</sourceband>
      <sourceproperties blockxsize="486" blockysize="1" datatype="Float32" rasterxsize="486" rasterysize="2017">
      <srcrect xoff="0" xsize="486" yoff="0" ysize="2017">
      <dstrect xoff="0" xsize="486" yoff="0" ysize="2017">
    </dstrect></srcrect></sourceproperties></simplesource>
  </metadata></vrtrasterband>
</vrtdataset>
Now I can use gdalwarp, note that you call the vrt file rather than the hdf!
gdalwarp -geoloc -t_srs EPSG:4326 C:\GW1AM2_201301311114_050A_L1SGBTBR_1110110.vrt C:\test100.tif
The resulting image is this one:

See also this page for this description and possible updates.


