11

I'm putting together an application where I need to create a vector grid which will be used to store and display a heatmap. It has the following requirements:

  • Can cover the entire planet.
  • The vast majority of grid squares won't have values.
  • I don't want to have to store the grid itself; I'd like to calculate it on the fly.
  • The scale of the data used with the grid could vary massively.
  • I anticipate wanting grid squares anything from 1km across to 100km across. (I'm aware how many this will be (~510million for 1km, ~51,000 for 100km)).
  • Values will be accumulated/aggregated for each grid square.
  • Ideally I'd be able to easily use smaller grid cells to calculate values for larger ones rather than store the larger grid cell values.
  • I'll be using OpenLayers to drape it over OpenStreetMap.
  • I'll be storing it in SpatiaLite or SQLite, so preferably supported by those natively (i.e. for SpatiaLite = a supported CRS; or for SQLite = a pure numbers based system).

So my question is: What projection should I use for this grid?

Also - is there a good way to designing this? Does anyone know of a good potential solution to this problem or have solved similar before? Or can point me in a useful direction.

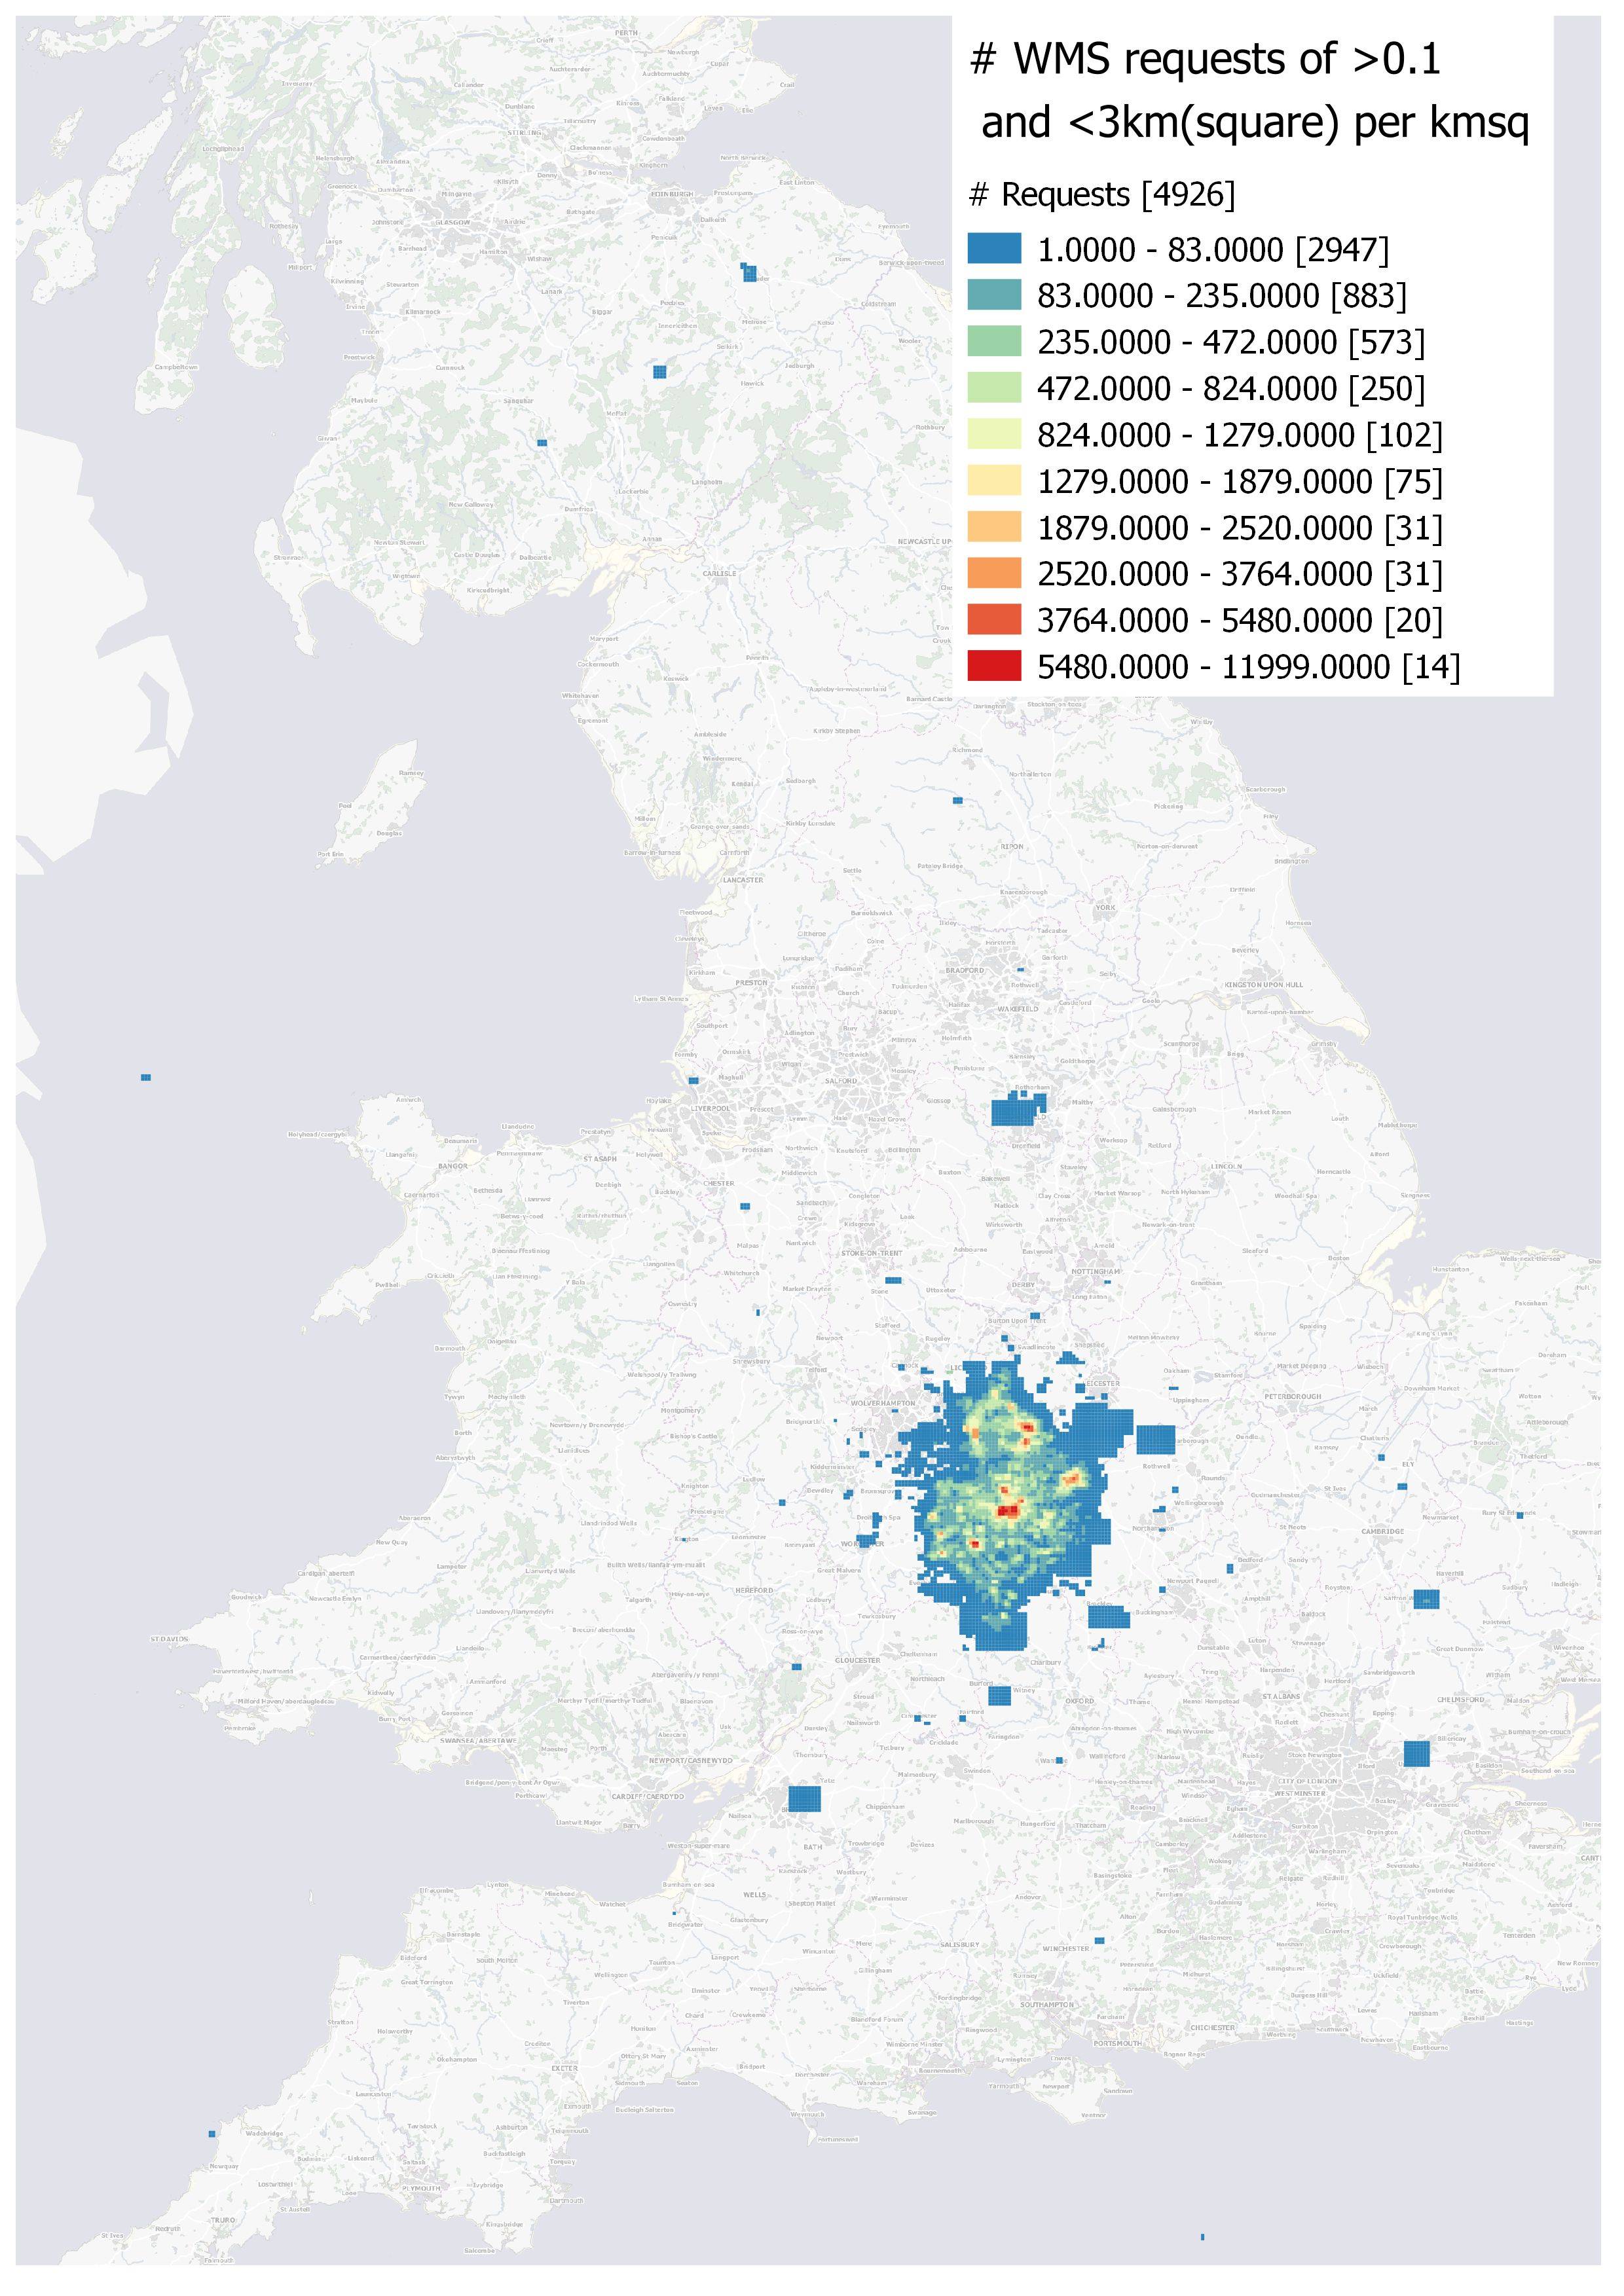
Edit Use-case - basically I'm aggregating up bounding boxes of various different shapes and sizes. They can be anything from a few hectares to thousands of square km in size. They may also be in different projections.

Below is a bespoke version of the sort of thing I'm aiming to accomplish automatically on a larger scale. enter image description here
Many thanks.

10
  • By no means necessarily a complete or perfect answer, but you may want to Google the Military Grid Reference System or at least the US National Grid fgdc.gov/usng for some ideas on how those organizations have handled at least similar challenges. Again, not necessarily perfect, but may be a good reference for your work. Hope it helps.
    – John
    Commented Aug 19, 2014 at 20:39
  • @John - Thanks; I came across the Military grid in my own searches, but it uses letters as well as numbers so I'm not sure it's suitable. The USNG stuff looks interesting but I'm not seeking to create my own. Commented Aug 26, 2014 at 11:56
  • 1
    Some information about the nature of the data and purpose of the heatmap will help focus the answers, which may (and ought to) vary according to what geographical properties you wish to preserve in the maps: orientation, bearing, area, shape, etc. Since reprojecting spatial data is relatively fast and easy, though, one might be led to discount these issues and focus instead on more fundamental ones of bias and accuracy: What do plan to do about the MAUP? Do you plan to draw any inferences from the data as binned into these grid cells? Why must it be a vector data structure?
    – whuber
    Commented Aug 26, 2014 at 13:39
  • Could you clarify what the spatial dimensionality of the uderlying data is? i.e. is the data fundametally point and only aggregated to the cell, or is it actually areal?
    – AnserGIS
    Commented Aug 27, 2014 at 13:50
  • @whuber - The data will be used for general representation to lay-users, not any form of spatial analysis. Thus no particular preference relating to which geographical properties are kept/lost and MAUP is irrelevant as I'm seeking a gross generalisation of the data. I only need the grid-squares to neatly overlay something like OSM tiles. My desire for vector is because I'm storing it in a database and it's much easier to manipulate. Commented Aug 27, 2014 at 14:45

3 Answers 3

3
+125

Standard OSM tiles are in Spherical Mercator (SRID=3857) so it will probably be easiest to build your grid using the same projection.

If you use SM, you might store the data at the highest zoom level OSM supports, or at the highest level zoom level you'll permit users to zoom into. If coverage is sparse, use a data structure along the lines of

XIndex, YIndex, Count

where the indexes are the indexes into the tile grid at your desired zoom level, count is the count of features that intersect that tile, and do not include entries for points where count is zero. Then you can simply select count by index or at lower zoom levels select sum of count by index range knowing that if the query returns nothing count is zero for the given region.

This is of course an abstraction, I'm assuming a software tier between this and your heat map renderer. More description of how you will render the heat map would help me give better advice.

3

The value stored in a cell from a heatmap is often normalized by its area. In this case I would rather suggest an equal area projection so that you can easily aggregate to larger scale

2
  • Are you planning to calculate the density on the projected plane or on a spherical surface and just display it this way? Also, does the rectangular data ever need to be apportioned accross more than one grid cell?
    – AnserGIS
    Commented Aug 28, 2014 at 13:03
  • @AnserGIS - The calculation will happen on a projected plane. The rectangular data may cover multiple grid cells. See also the edit for more information. Commented Aug 29, 2014 at 7:33
2

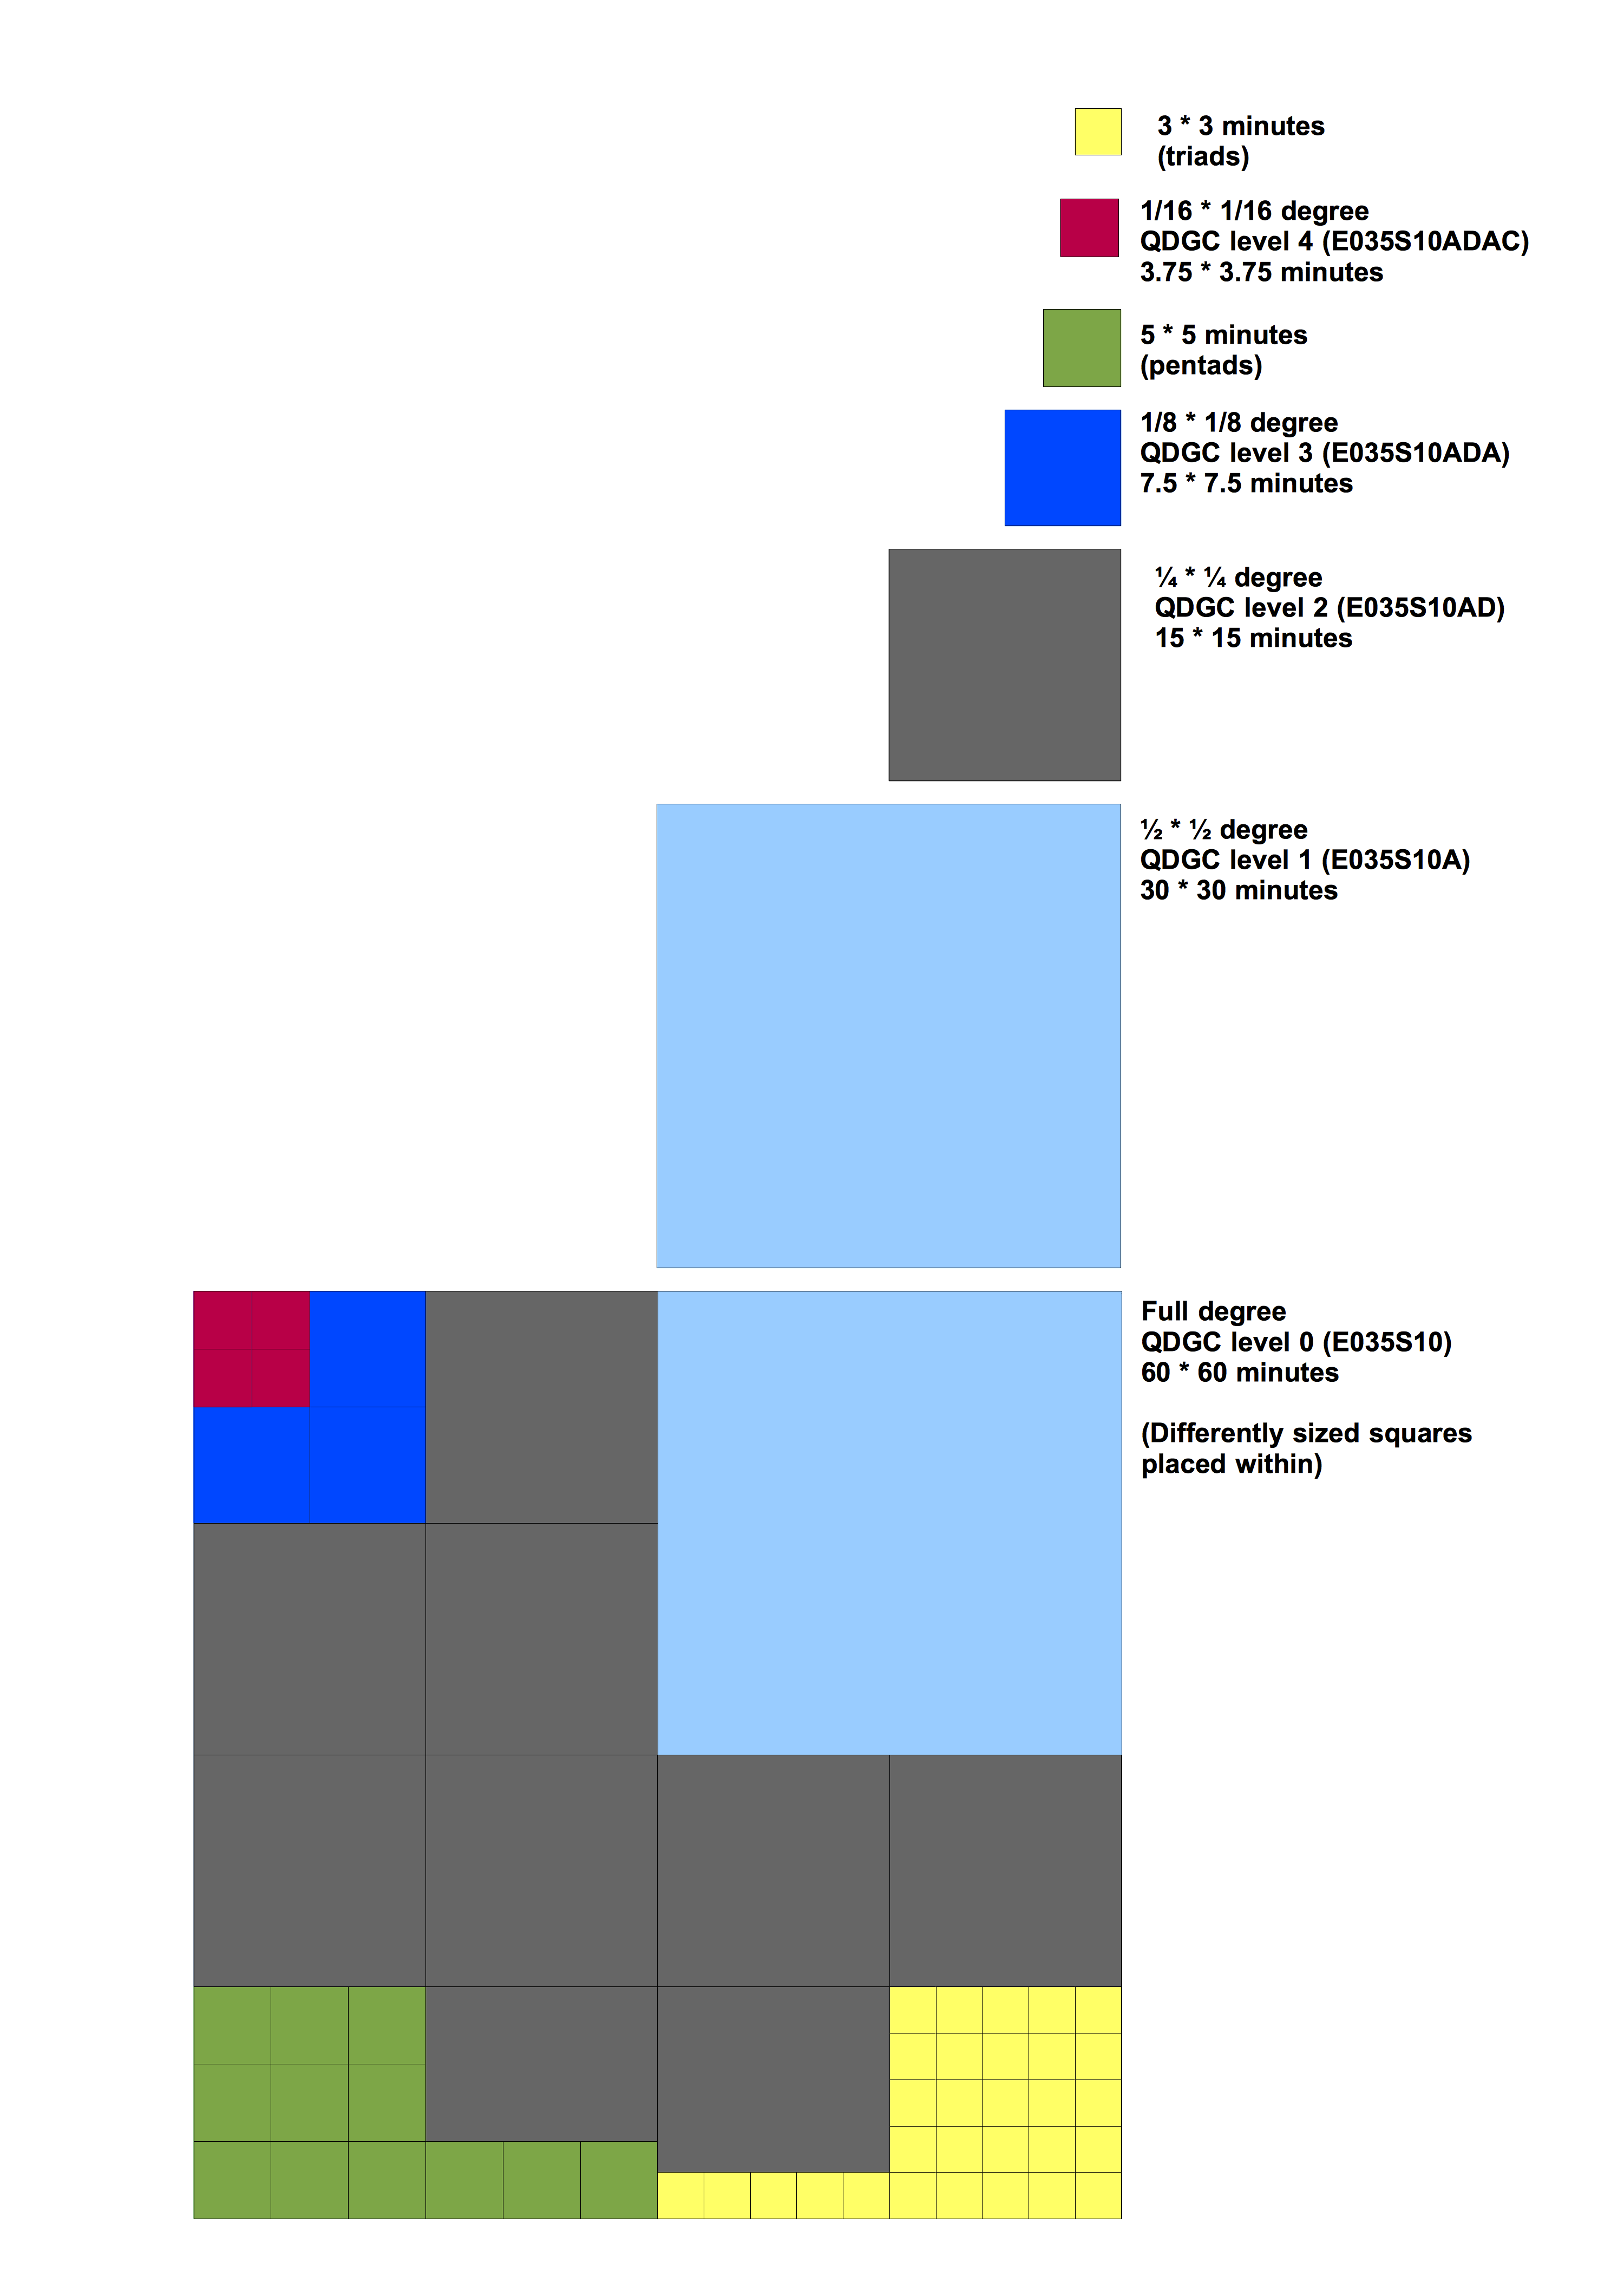
This is an answer to how you could design a heatmap. My suggestion is you look into the Quarter Degree Grid Cell system. QDGC represents a way of making (almost) equal area squares covering a specific area to represent specific qualities of the area covered. The squares themselves are based on the degree squares covering earth. Around the equator we have 360 longitudinal lines lines, and from the north to the south pole we have 180 latitudinal lines. Together this gives us 64800 segments or tiles covering earth. The form of the squares becomes more rectangular the longer north we come. At the poles they are not square or even rectangular at all, but end up in elongated triangles.

The grid cells can be divided in four, and the resulting grid cells again split in four. The system provides the user with a predictable naming convention. By calculating the areas for the different grid cells they should be suitable for area dependent presentations. The Quarter Degree Grid Cells nomenclature is recursive.

More detailed information, and references to some other systems is also available in a paper I published some years ago. The standard is used in several African atlases for environmental information.

Shapefiles for different continents and countries is available for download on my blog site.

I have played around with the thought of extending the standard, so that the grid cells above or below a certain latitude could be split in two thus providing a more visually pleasing map product when used.

2
  • 1
    Thanks for sharing; interesting idea. Certainly seems like it might be useful for this. I'm assuming it wouldn't be too much effort to alter it so that it was purely numerical? i.e. no "E" or "N"? That would probably allow for easier and more efficient aggregation of cells, especially at the meridian or equator. Commented Sep 16, 2014 at 18:40
  • One good reason to keep the characters (text) is to keep it human readable.For use in atlases and human reference it serves the purpose well. It would of course be possible by using this for example this representation: E=0,W=1,S=0,N=1, A=1,B=2,C=3 and D=4. Some well written code snippets in python or other relevant scripting language should be able to "bridge" the meridian/equator challenges at little cost. Of course depending on your QDGC operation level and data set size.
    – ragnvald
    Commented Sep 17, 2014 at 12:07

Your Answer

By clicking “Post Your Answer”, you agree to our terms of service and acknowledge you have read our privacy policy.

Not the answer you're looking for? Browse other questions tagged or ask your own question.