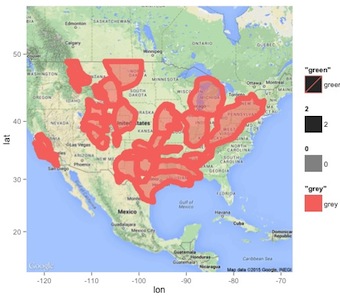
I'm trying to plot a EIA shapefile onto Google Map. I have a code working with the map function but can't get it to work with the ggmap function. Where am I going wrong?
Working code:
library(maps)
map("state")
shapLocation<- "C:/shapfile/shalegasbasin/"
pcontorta <- readShapePoly(paste(shapLocation,"US_ShaleBasins_EIA_May2011.shp",sep=""))
plot(pcontorta, add=TRUE,  col=adjustcolor("black", alpha.f = 0.6),  border=FALSE)
shapefile from: http://www.eia.gov/maps/layer_info-m.cfm
Changed code to:
map <-get_map(location = "united states",zoom = 4,  filename=outFiles)
ggmap(map)

WGS84 <- CRS("+proj=longlat +ellps=WGS84 +datum=WGS84 +no_defs +towgs84=0,0,0")
shapLocation<- "C:/Users/jecrosbie/Documents/Oil Weekly/shapfile/shalegasbasin"
data.shape<-readOGR(shapLocation,, layer= "US_ShaleBasins_EIA_May2011")
data.shape<- spTransform(data.shape, CRS("+proj=longlat +datum=WGS84"))
data.shape<-fortify(data.shape)

map <- map + geom_polygon(aes(x=long, y=lat, group=group), fill='grey',     size=.2,color='green', data=data.shape, alpha=0)
map
output error: ............. [68,] "#A7C8FD" "#A7C8FD" "#A2C4FC" "#A2C4FC" "#A2C4FC" "#A2C4FC" "#8CA488" [69,] "#A7C8FD" "#A7C8FD" "#A2C4FC" "#A2C4FC" "#A2C4FC" "#A2C4FC" "#8CA488" .............

