12

I need a special projection for the purpose of effective presentation on a poster. I'd like to present the study area (Czech republic) in a context of whole Europe in such a way, that the Czech republic takes the most area (like 70%) in the center, and the rest of Europe is around it, but ridiculously small. I.e. like massive distortion in favor of the Czech republic, like a fish-eye lens, when you put them close to some object and they will massively magnify it compared to the surroundings.

Is there any projection I can use for this purpose in Quantum GIS? EPSG or the formula in standard (which can be used in QGIS) is welcome.

12
  • 1
    You could make this with a distance or area cartogram. I am not aware of any QGIS solutions. You could also make it through a simple custom transformation of the coordinates, if you know how to program such things. No standard projection will create such a map for you, due to the extreme distortions involved.
    – whuber
    Commented Aug 17, 2015 at 14:59
  • 1
    This could be done, but you have to be clever about it. By starting in projected coordinates and then unprojecting with a projection that uses a smaller spheroid, you can in effect make a small part of the world seem to be most of a hemisphere. Reprojecting the resulting coordinates with just about any projection suited for that hemisphere would do the trick. What you gain in terms of not having to code any coordinate transformations yourself must be balanced against (a) having to do a lot of trial-and-error experimentation and (b) having minimal control over the distortion around the edges.
    – whuber
    Commented Aug 17, 2015 at 15:50
  • 4
    I would use the cartogram route. Simple tools with ready implementation. Just make the value for the Czech rep. much larger than the rest of Europe: scapetoad.choros.ch
    – HeikkiVesanto
    Commented Aug 17, 2015 at 16:11
  • 1
    If you are not limited by rasters in that map, then the way to go is definitely export to SVG and use Inkspace or other vector graphics editor to make the magnifying glass effect. If you work with vectors, there won't be any ugly pixel issues. +1 for the Czech Republic :)
    – Miro
    Commented Aug 19, 2015 at 0:19
  • 1
    Here is a tutorial for CorelDraw: youtube.com/watch?v=YE9hu1g20Gc , in Inkscape you shoul be achieve similar with envelope deformation: wiki.inkscape.org/wiki/index.php/Envelope_Deformation
    – Miro
    Commented Aug 19, 2015 at 0:54

5 Answers 5

8

You might try one of Snyder's Magnifying Glass projections found on http://www.csiss.org/map-projections/Azimuthal.html No 32 to 36.

They are based on this publication: https://pubs.er.usgs.gov/publication/70014498

I'm not sure if there is an online resource with the formulas.

Hägerstrand’s Logarithmic Map might also fit your needs: http://www.ncgia.ucsb.edu/projects/tobler/Projections/sld105.htm

Or a square root azimuthal projection: http://www.ncgia.ucsb.edu/projects/tobler/Projections/sld109.htm

References can be found in http://www.cartoperspectives.org/index.php/journal/article/download/cp59-tobler/307 and in "Small-Scale Map Projection Design" by Frank Canters (available from Google books).

2
  • Thanks Andrej! That all looks very interesting! But without the formulas or epsgs or any other easy way how to use them I will not be able to use it :-(
    – Tomas
    Commented Aug 18, 2015 at 8:36
  • 1
    There will be no EPSG code (no oil searching will be made with those maps!), but you can look out for the publications.
    – AndreJ
    Commented Aug 18, 2015 at 9:08
7

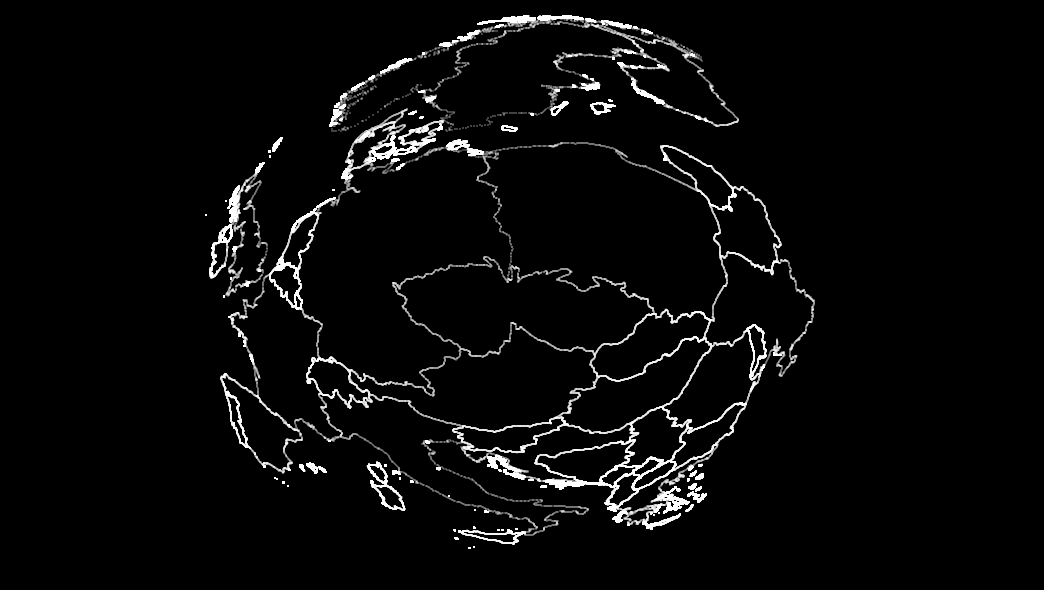
Here's a pseudo-fisheye done in Postgres/Postgis. I used QChainage plugin to create 1000 points along each country border. The points were reprojected around null island (0,0) using the logarithm of distance, but with azimuth preserved.

enter image description here

I used Plat Caree to make it circular, as wgs84 gives a more ellipsoid appearance.

select
    st_asewkt(
        st_endpoint(
            st_scale(
                st_rotate(
                    st_makeline(
                        st_setsrid(st_makepoint(0,0),4326),
                        st_setsrid(st_makepoint(0,1),4326)
                    ),
                    st_azimuth(
                        st_setsrid(
                            st_makepoint(0,0),
                            4326
                        )
                        ,
                        ST_translate(geom,-15.0,-50.0)
                    ) 
                ),
                -(1.0+(7.0*log(ST_Distance(st_setsrid(st_makepoint(0,0),4326),ST_translate(geom,-15.0,-50.0))))),
                (1.0+(7.0*log(ST_Distance(st_setsrid(st_makepoint(0,0),4326),ST_translate(geom,-15.0,-50.0)))))

            )   
        )
    ) as pt

from
    qqq3lines
2
  • interesting, thanks Steven! Can it be made more so that the Czech Rep is even bigger compared to the rest?
    – Tomas
    Commented Aug 18, 2015 at 23:48
  • @tomas yes... you need to tweak the constants I used in the st_scale().. try increasing the 1.0 to 2.0, and decreasing the 7.0 to something smaller.
    – Steven Kay
    Commented Aug 19, 2015 at 0:02
6

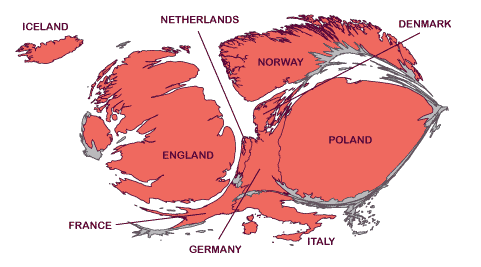
While not fish eye, you can make this style of map as a cartogram.

The benefits of this is that there are ready made tools for the job and will work with a robust set of datasets.

Just make the value for the Czech Republic much larger than the rest of Europe, adjusting the values to suit needs.

A great tool for this is: ScapeToad

enter image description here

3
  • Thanks Vesanto, this is exactly what I needed! :-) Ready-to-use, user-friendly tool! I finally used this. And it pretty looks much like fish-eye to me :-)
    – Tomas
    Commented Aug 19, 2015 at 11:18
  • The only thing to note is that it was very very slow, so I had to choose the slowest settings and even lower the number of grid cells manually.. but it looks great. The only thing I regret is that it won't be easy to do this with rasters.
    – Tomas
    Commented Aug 19, 2015 at 11:21
  • 2
    you can speed things up by using qgis to simplify the geometries, or use a lower resolution shapefile (like the 50m or 110m from Natural Earth)
    – Steven Kay
    Commented Aug 19, 2015 at 15:11
1

D3 has a fisheye distortion plugin, which I found by Googling "svg fisheye transform".. It might be useful for your situation. Basically, I'm suggesting converting some of your shapefiles to SVG (or GeoJSON?) making your map using the increasingly popular D3.js library.

My thinking was, I knew the country boundary geometries could be converted to SVG vector types, and I suspected that as SVG, there might be more suitable approaches to implement the fisheye transform you're desiring.

I agree with the other commenters that illustration/graphic software is more appropriate to your scenario, and since D3 works with some common data formats (SVG and GeoJSON), it may provide a solution for you.

2
  • thanks, but isn't D3 a library for programmers, for web creators? I possibly need a program that will create a single picture for me, possibly without a need of programming.
    – Tomas
    Commented Aug 17, 2015 at 15:44
  • @Tomas, fair enough. Since your question is simply titled "Fisheye-like projection", though, it's going to have a strong search ranking in google for similar queries, which over time will likely include some developers. Eventually this answer might be useful to someone else.
    – elrobis
    Commented Aug 18, 2015 at 14:27
0

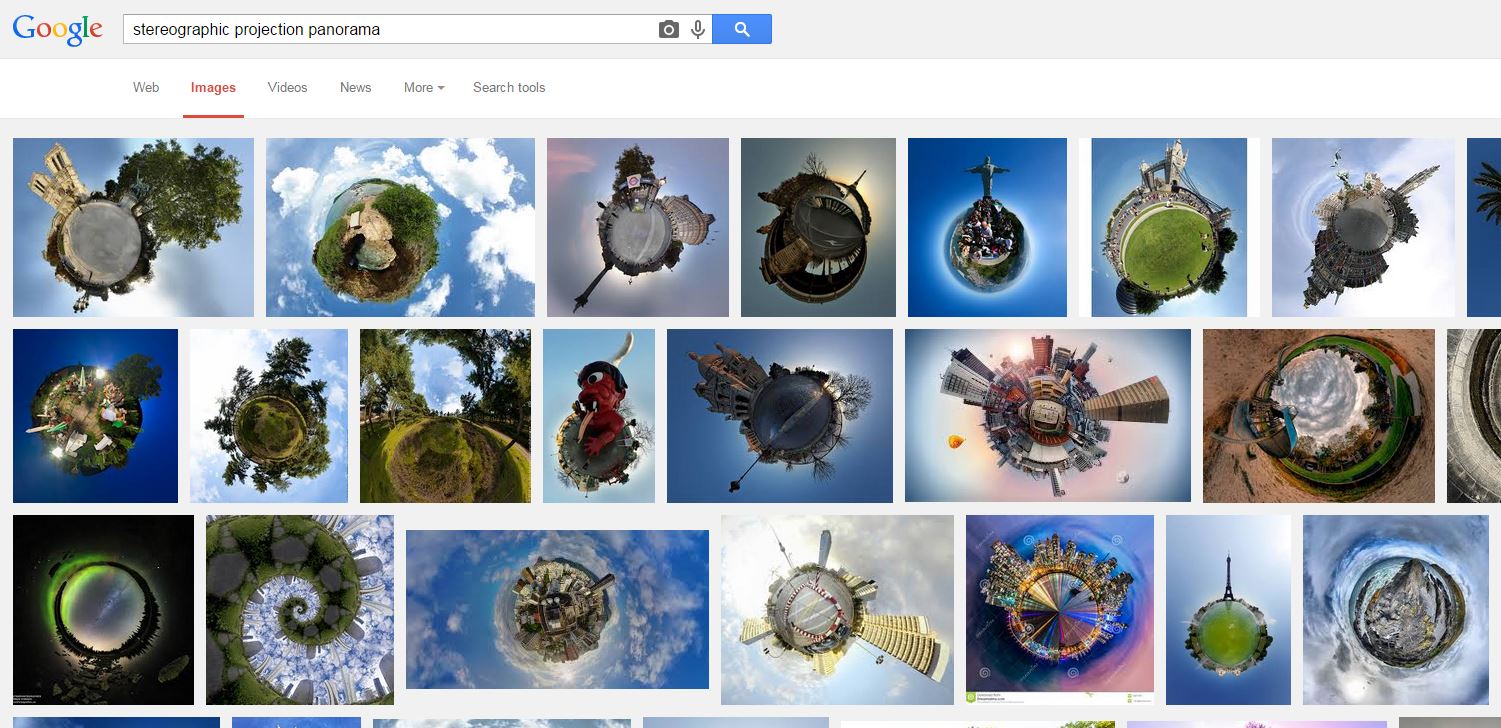
I think you will need an extreme distortion for the Czech Republic to look like that. There is a fairly popular photographic "stereographic projection" technique sometimes used in panorama photography to create "globe worlds" which may work if you used the result as overlay over Europe. (Do not consider this an answer as this is purely hypothetical and I've never tried it with a map) Also, this would be more of a graphics/photo editing project because you would probably have to photograph your printed map or possibly export it out of GIS to a high resolution image then then copy and crop a series of images around a central point (centered on a uniform area in the middle with sufficient overlap) so that they can be used as input into the panorama function. Once you have the "stereographic projection" image created you could then overlay over a map of Europe.

Of course you would need to add labels after the fact in Illustrator, Corel Draw or by importing the final image as raster back into GIS and creating some graphics/ annotations.

Google "stereographic projection panorama" to see examples.

Here is an example tutorial: http://www.photographymad.com/pages/view/little-planet-photos-5-simple-steps-to-making-panorama-worlds

enter image description here

Your Answer

By clicking “Post Your Answer”, you agree to our terms of service and acknowledge you have read our privacy policy.

Not the answer you're looking for? Browse other questions tagged or ask your own question.