There are 2 scripts at work.
First creates attachment – text file - in data driven pages polygon stored in FGDB, name in TOC = Pages.
Data sourced into attachment table from layer called ‘pnts’, it has to have page definition query active.
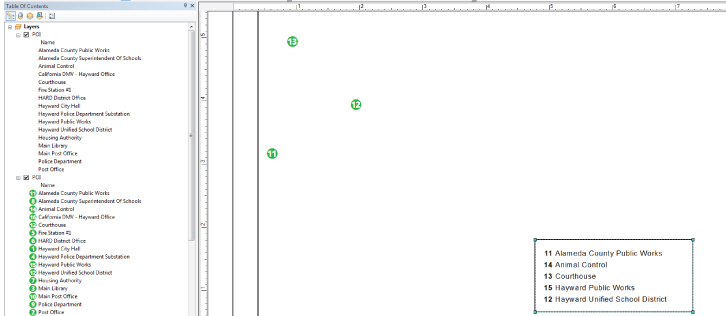
To control appearance of future table you’ll need text element in your layout called TABLE.
This is what tool expects as parameters:
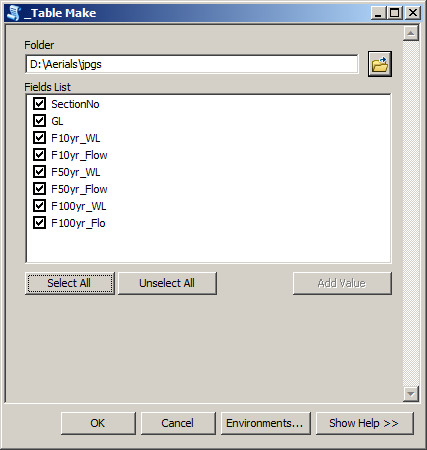
The values in field list are field names from ‘pnts’ that you want to show:
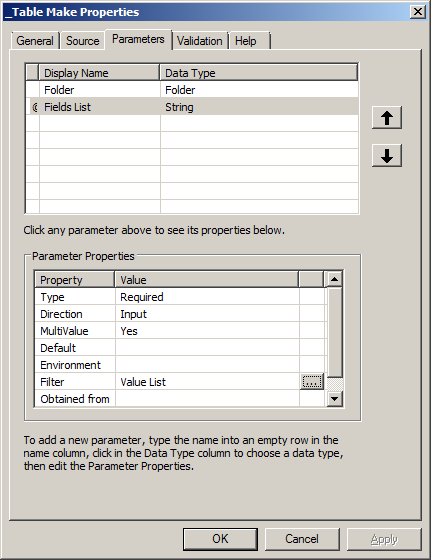
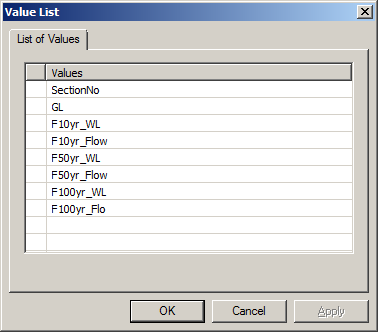
Yes you have to change list to suit you needs.
Script iterates through pages and does:
- Remove existing attachment
Create attachment from values taken from pnts table within current
DDP.
(I usually create a small buffer around pages, intersect it with pnts. This create 2 pnts where buffers overlaps)
I use is Calibri Light font for text in the TABLE.
Script:
import arcpy, traceback, os, sys, numpy
from arcpy import env
env.overwriteoutput=True

folder=arcpy.GetParameterAsText(0)
allNames=arcpy.GetParameterAsText(1)
fldNames=allNames.split(';')
table=r'in_memory\attach'


#Reference MXD and layers
try:
  def showPyMessage():
    arcpy.AddMessage(str(time.ctime()) + " - " + message)
  def isLayerExist (mxd,lName):
    layers = arcpy.mapping.ListLayers(mxd,lName)
    if len(layers)==0:
            raise NameError,'\n'+lName + " layer not found. Exiting.."+'\n'
    result=layers[0]
    return result

  mxd = arcpy.mapping.MapDocument("CURRENT")
  thePagesLayer = isLayerExist(mxd,"Pages")
  thePointsLayer = isLayerExist(mxd,"pnts")
  ddp = mxd.dataDrivenPages
  fld = ddp.pageNameField.name
  Page_Names=arcpy.da.TableToNumPyArray(thePagesLayer, fld)
  for elm in arcpy.mapping.ListLayoutElements(mxd):
    if elm.name == "TABLE":
      tableTxt = elm
      x=elm.elementPositionX
      y=elm.elementPositionY


##   THING TO CHANGE !!!!!
  formatS="{:5d}{:8.2f}{:8.2f}{:8.2f}{:8.2f}{:8.2f}{:8.2f}{:8.2f}"

  for pageID in range(1, ddp.pageCount+1):
    arcpy.AddMessage(pageID)
    ddp.currentPageID = pageID
    arcpy.RefreshActiveView()
    fOut=folder+os.sep+Page_Names[pageID-1][0]+".txt"
    arcpy.SelectLayerByAttribute_management(thePointsLayer)
    linkValue=Page_Names[pageID-1][0]
    attachName=Page_Names[pageID-1][0]+".txt"
    arcpy.CreateTable_management('in_memory', 'attach')
    arcpy.AddField_management(table, "Page", "TEXT", "", "", 25)
    arcpy.AddField_management(table, "Page2", "TEXT", "", "", 250)
    curT = arcpy.da.InsertCursor(table,("Page","Page2"))
    theRow=(linkValue,fOut)
    curT.insertRow(theRow)
    arcpy.RemoveAttachments_management(thePagesLayer,
                                       fld, table,
                                       "Page")
    textB=""
    tbl=arcpy.da.TableToNumPyArray(thePointsLayer,fldNames)
    tbl=numpy.sort(tbl)
    if len(tbl)>0:
      m=0
      for rec in tbl:
  ##   THING TO CHANGE !!!!!
        bit=formatS.format(rec[0],rec[1],rec[2],rec[4],rec[6],rec[3],rec[5],rec[7])
        textB+=bit+'\n'
        m+=1
        if m>54: break
      tableTxt.text = textB
      arcpy.SelectLayerByAttribute_management(thePointsLayer, "CLEAR_SELECTION")
      tableTxt.elementPositionX=x
      tableTxt.elementPositionY=y
      arcpy.RefreshActiveView()
    fileO = open(fOut, 'w')
    fileO.write(textB)
    fileO.close()
    arcpy.AddAttachments_management(thePagesLayer, fld,
                                    table, "Page", "Page2")
    arcpy.Delete_management(fOut)

except:
    message = "\n*** PYTHON ERRORS *** "; showPyMessage()
    message = "Python Traceback Info: " + traceback.format_tb(sys.exc_info()[2])[0]; showPyMessage()
    message = "Python Error Info: " +  str(sys.exc_type)+ ": " + str(sys.exc_value) + "\n"; showPyMessage()
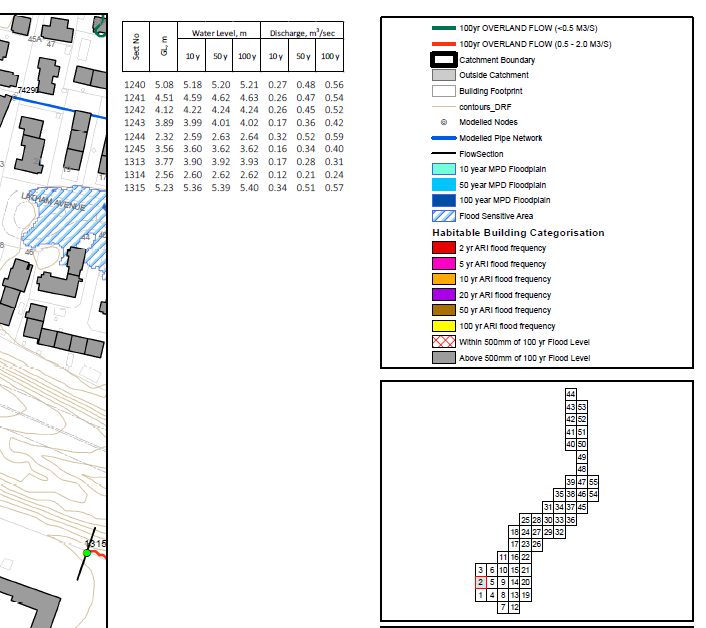
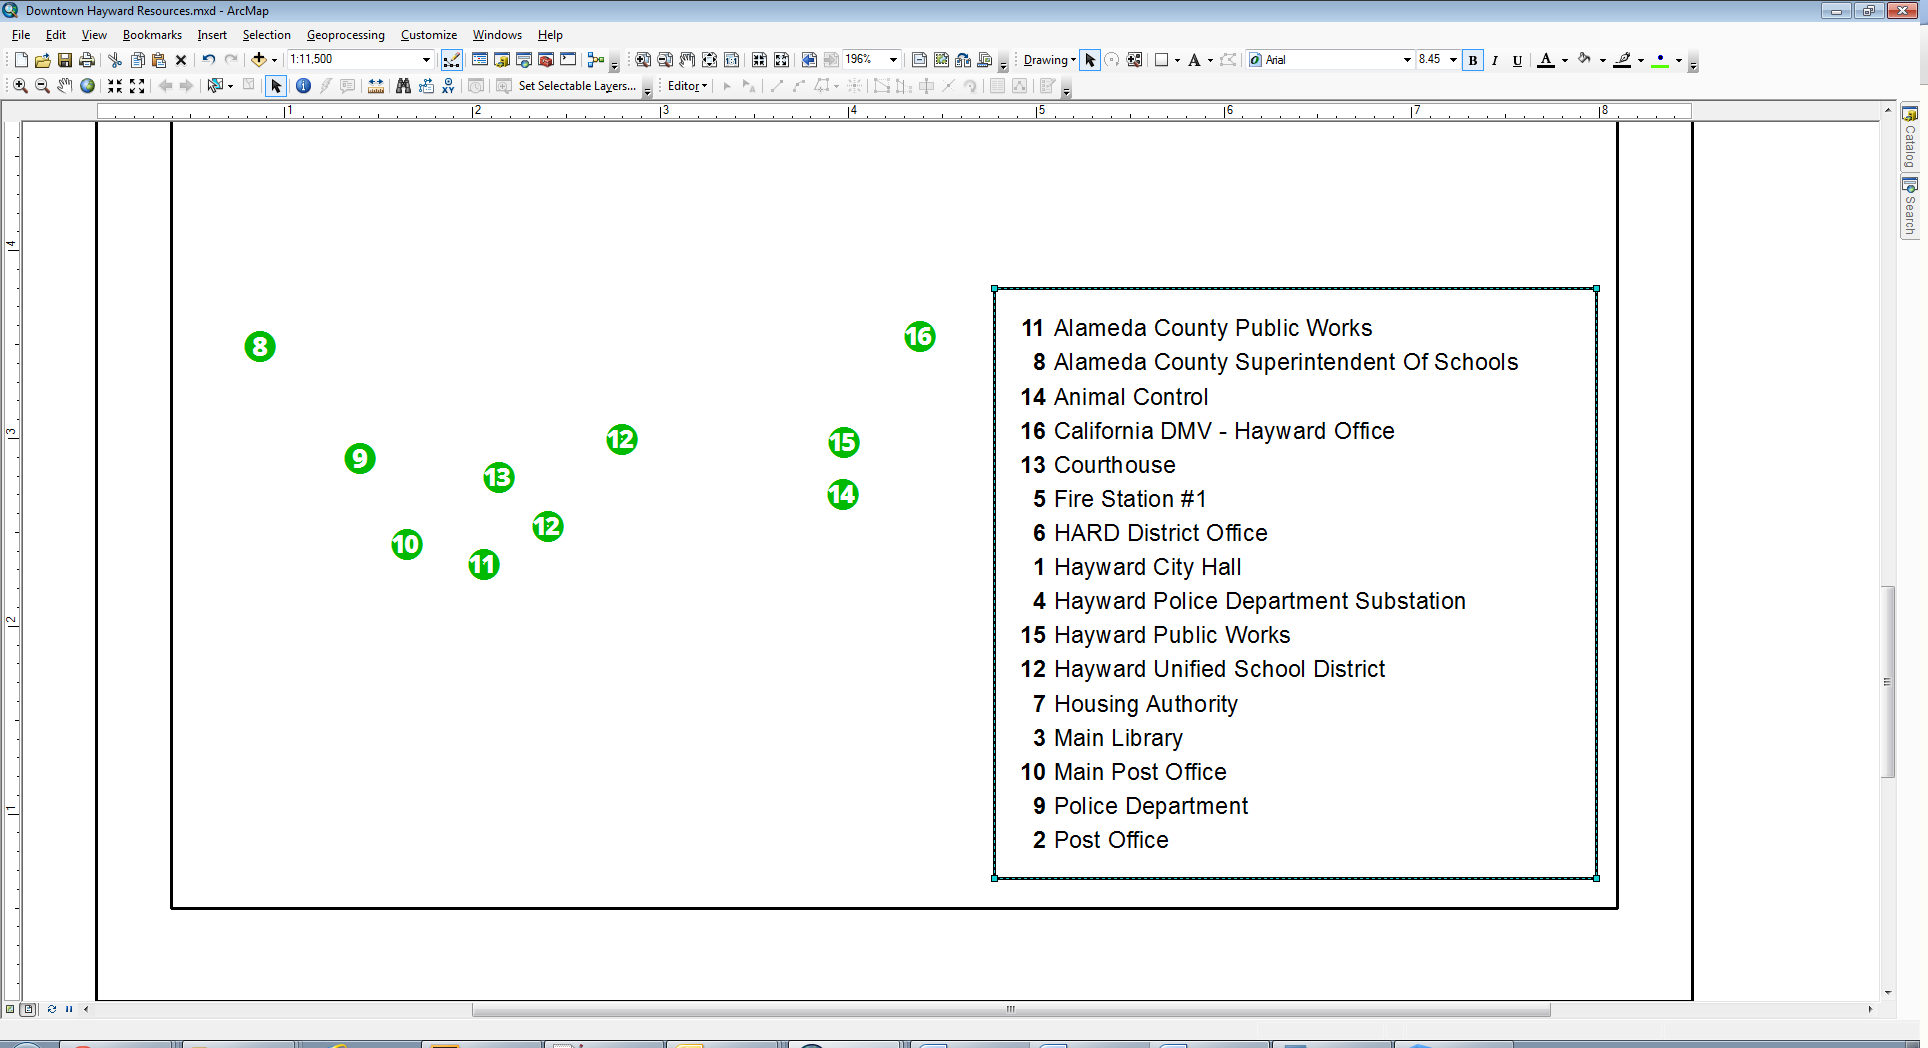
Output example I am using to control how prints will look like:
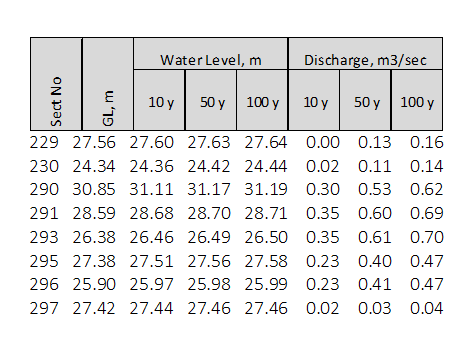
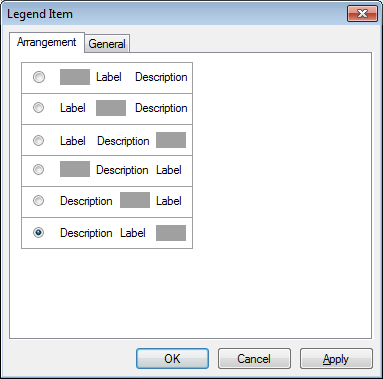
Note grey part is separate element here. You also have to change text format line in above script.
Second script does printing (export to pdf, using DDP name), assumes DDP layer name = Pages (the one with attachmet) and there is text element called TABLE in the layout
import arcpy, traceback, os, sys
from arcpy import env
env.overwriteoutput=True

folder=arcpy.GetParameterAsText(0)
aTable=arcpy.GetParameterAsText(1)


#Reference MXD and layers
try:
    def showPyMessage():
        arcpy.AddMessage(str(time.ctime()) + " - " + message)
    def isLayerExist (mxd,lName):
        layers = arcpy.mapping.ListLayers(mxd,lName)
        if len(layers)==0:
            raise NameError,'\n'+lName + " layer not found. Exiting.."+'\n'
        result=layers[0]
        return result

    mxd = arcpy.mapping.MapDocument("CURRENT")
    thePagesLayer = isLayerExist(mxd,"Pages")
    ddp = mxd.dataDrivenPages
    fld = ddp.pageNameField.name
    diction={}
    both=arcpy.da.TableToNumPyArray(thePagesLayer, (fld,"OBJECTID"))
    for row in both:
        diction[row[0]]=row[1]
    Page_Names=[row[0] for row in both]
    del both
    #Reference page layout elements
    for elm in arcpy.mapping.ListLayoutElements(mxd):
        if elm.name == "TABLE":
            tableTxt = elm
            x=elm.elementPositionX
            y=elm.elementPositionY

    for pageID in range(1,ddp.pageCount+1):
    ##  for pageID in range(1,3):
        ddp.currentPageID = pageID
        baseName=Page_Names[pageID-1]
        OID=diction[baseName]
        query='REL_OBJECTID = %s' %str(int(OID))
        with arcpy.da.SearchCursor(aTable,'DATA',query) as cursor:
            for row in cursor:
                binaryRep = row[0]
                textB=binaryRep.tobytes()
            if len(textB)>0:
                tableTxt.text = textB
            else:
                tableTxt.text = "            "
        tableTxt.elementPositionY=y
        arcpy.RefreshActiveView()
        ddp.exportToPDF(folder+os.sep + baseName + ".pdf","CURRENT")
        arcpy.AddMessage('Exported %i %s' %(pageID,baseName))
except:
    message = "\n*** PYTHON ERRORS *** "; showPyMessage()
    message = "Python Traceback Info: " + traceback.format_tb(sys.exc_info()[2])[0]; showPyMessage()
    message = "Python Error Info: " +  str(sys.exc_type)+ ": " + str(sys.exc_value) + "\n"; showPyMessage()
In above example points are labelled by SectionID and table provides perfect reference.
This couple saved me weeks of time...
I am using 2 scripts because formatting is a hard part, so I run first script with only 2 layers - points and pages on a very basic mxd. Second works fine and I run it on the map with multiple layers, symbology sorted etc
This is an upper right corner of one of the output pages:
