17

In ArcMap, it is possible to automatically calculate the unique values for a raster and then apply a different style to each unique value (see 1st image).

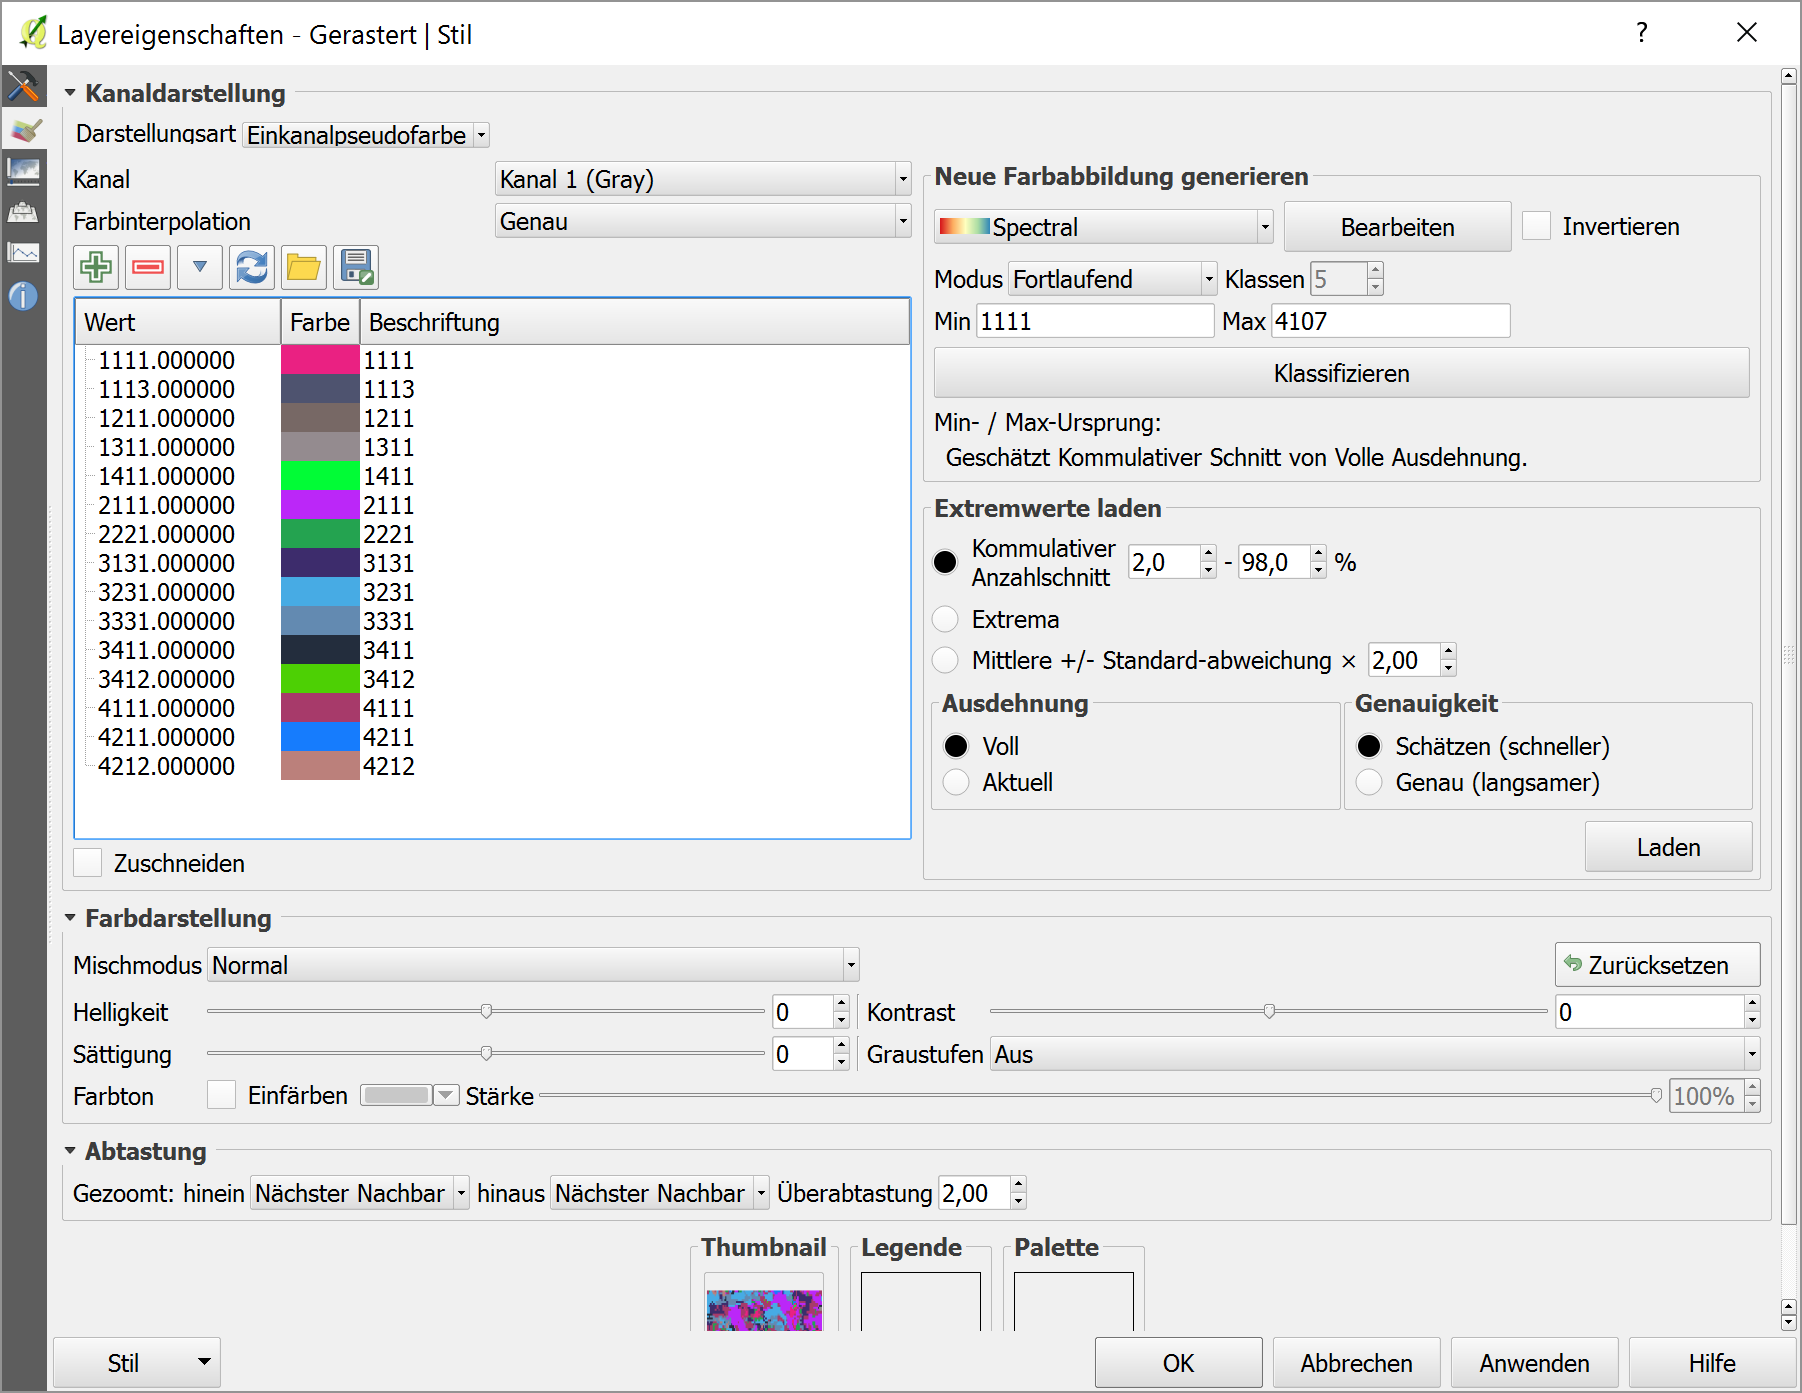
However, in QGIS, I have to manually add values for styling when using the "Singleband pseudocolor" style (see 2nd image). Is there a way of auto-populating the unique values like ArcMap does?

ArcMap:

ArcMap raster symbology unique values

QGIS (how to auto-populate the value list with unique values?):

QGIS raster stlying

2
  • You have the classification on the right side. Not sure why you cut this in your Screenshot as these are the options you need... Just set the number of classes to your max - min difference +1 . Use the mode same interval. Problem might be when your data is not contigous, then you need to delete the not used values.
    – Matte
    Commented Apr 21, 2016 at 10:05
  • @Matte Indeed, however we usually have non-contiguous data with large gaps. Thus it is not practical to delete the values not actually within the raster (say for example the only values are 1 and 1000000 you would have to manually delete a LOT of numbers). Plus, this assumes some a priori knowledge of the unique values within the raster... Commented Apr 21, 2016 at 10:29

2 Answers 2

7

Here is an approach that might be helpful. The GRASS tool r.report is capable of computing a basic statistic for each unique value in a raster layer:

enter image description here

The output can be written als a plain txt file looking like this (left: unique values, right: area covered by each value):

+-----------------------------------------------------------------------------+
|                      Category Information                        |    square|
|   #|description                                                  |     miles|
|-----------------------------------------------------------------------------|
|1111| . . . . . . . . . . . . . . . . . . . . . . . . . . . . . . |  1.249845|
|1113| . . . . . . . . . . . . . . . . . . . . . . . . . . . . . . |  0.062666|
[...]
|3412| . . . . . . . . . . . . . . . . . . . . . . . . . . . . . . |  0.013926|
|4111| . . . . . . . . . . . . . . . . . . . . . . . . . . . . . . |  4.713902|
|4211| . . . . . . . . . . . . . . . . . . . . . . . . . . . . . . |  0.083555|
|4212| . . . . . . . . . . . . . . . . . . . . . . . . . . . . . . |  0.135777|
|-----------------------------------------------------------------------------|
|TOTAL                                                             | 17.048727|
+-----------------------------------------------------------------------------+

The following geoprocessing script takes this text file as an input and sets up a suitable renderer (with random colors for convenience) for the raster layer (Inspired by LAWHEAD, J.: QGIS Python Programming Cookbook, p. 135):

##giswg=group
##thexml=file
##theraster=raster
from random import randint
from PyQt4.QtGui import QColor
from qgis.core import *
myraster = processing.getObject(theraster)
infile = open(thexml, 'r')
univalues = [l.split('|')[1] for l in [f for f in infile.readlines()][4:-4]]
s = QgsRasterShader()
c = QgsColorRampShader()
c.setColorRampType(QgsColorRampShader.EXACT)
i = []
for u in univalues:
    i.append(QgsColorRampShader.ColorRampItem(float(u), QColor('#%06x' % randint(0, 2**24)), u))
c.setColorRampItemList(i)
s.setRasterShaderFunction(c)
ps = QgsSingleBandPseudoColorRenderer(myraster.dataProvider(), 1, s)
myraster.setRenderer(ps)

Thanks to the legendary processing capabilities of QGIS you can put these two together in the graphical modeler and add a raster parameter in order to simply choose a loaded raster layer:

enter image description here

After saving the model, by double clicking it in the processing toolbox it can be used like a normal tool:

enter image description here

With a result looking like this (outcrop of a rasterized natura2000 dataset):

enter image description here

Or in the layer properties:

enter image description here

I think this needs some refinement in user experience, but it's a first step.

2
  • 1
    not the best user experience but thanks for sharing
    – RutgerH
    Commented Jan 23, 2018 at 16:07
  • With seeing only the tool created as the UI, there's nothing wrong with the user experience, I think. And who knows, what's happening behind the scene in ESRI Geoprocessing tools... Commented Jan 24, 2018 at 11:14
3

For those still looking for this. Unique raster values have been added to QGIS 3. "Added by Nyall Dawson about 1 year ago

[FEATURE] Allow classifying paletted renderer using unique values from a raster layer

Adds an easy way to style discrete rasters such as landuse classes using the Paletted renderer. Just select the Paletted renderer, pick a band, then hit the "Add Unique Values" button. The unique pixel values will be fetched from the layer and a color assigned to each using the currently selected color ramp."

Your Answer

By clicking “Post Your Answer”, you agree to our terms of service and acknowledge you have read our privacy policy.

Not the answer you're looking for? Browse other questions tagged or ask your own question.