3

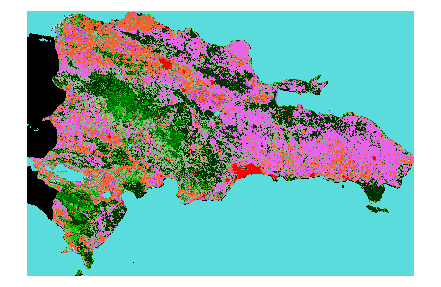
I want to produce one PNG image for each country in the world. The pixel colors come from a raster that describes the vegetation, and the boundaries of the countries come from a shapefile.

I managed to do almost all of it using the raster and rgdal libraries in R:

library(raster)
r <- raster('gm_lc_v3.tif')
library(rgdal)
p <- readOGR('ne_10m_admin_0_countries','ne_10m_admin_0_countries')
i <- 66 # Dominican Republic, a small country for fast example
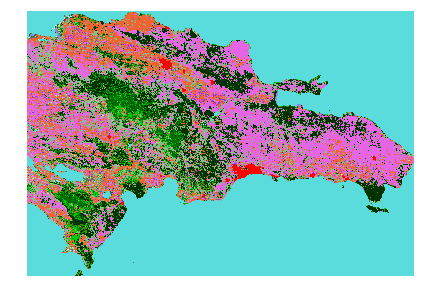
country <- crop(r,p[i,]) # produces the rectangular crop below
plot(country)

no_mask

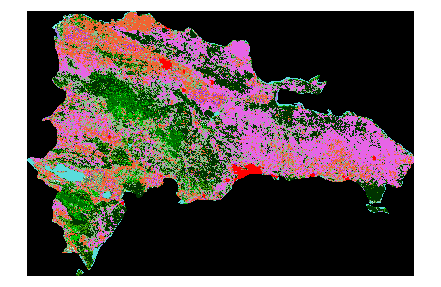
m1 <- mask(country,p[i,]) # crops on the country boundary
plot(m1)

mask1

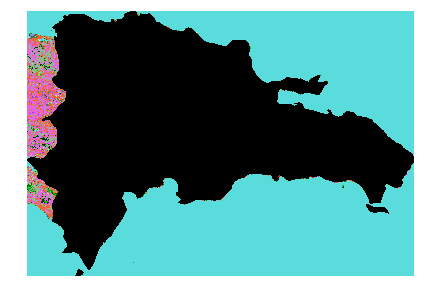
m2 <- mask(country,p[i,],inverse=T) # crops outside the boundary

mask2a

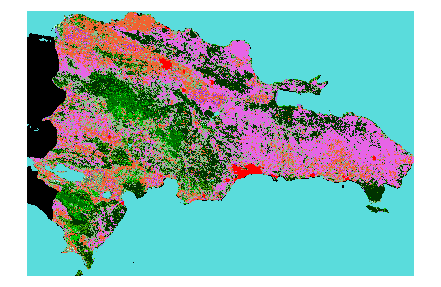
m2[m2 < 20] <- NA # turns all land into NA

mask2b

What I need now is to combine the two rasters (m1 and m2) into a single raster, with all data from the country, and only land/water data from outside the country. Like this (made in Gimp):

maskFinal

I have tried all the following so far, but without success:

m3 <- cover(m1,m2)
m3 <- cover(m1,m2,identity=T)
m3 <- merge(m1,m2)
m3 <- overlay(m1,m2,fun=function(x,y){return(x+y)})
m3 <- mask(m1,m2)
m3 <- stack(m2,m1)

They return all black, or different colors from the original. What am I missing?

1
  • Try changing all your NA's to 0 (assuming no 0s in the grid) then just add them.
    – Badger
    Commented Sep 15, 2016 at 22:02

2 Answers 2

3

Use the function plot (look at the help from package raster) with the argument add = TRUE

plot(m2, col='black')
plot(m1, col=rev(terrain.colors(255)), box=FALSE, axes=FALSE, add = TRUE)

Or Try this

plot(m1)
image(m2, add = TRUE, col = 'black')
10
  • It doesn't work, with or without the 'col' parameter.
    – Rodrigo
    Commented Aug 17, 2016 at 13:53
  • Also tried using the 'alpha' parameter, but it didn't work.
    – Rodrigo
    Commented Aug 17, 2016 at 14:00
  • @Rodrigo In which way 'it doesn't work?'
    – nebi
    Commented Aug 17, 2016 at 14:57
  • With 'col' (like you used it), I got a big square over the (correctly merged) map. Without the 'col' parameter, the second plot simply erases the first (what's strange, because the 'add=T' is still there, and all the NAs really should have become transparent).
    – Rodrigo
    Commented Aug 17, 2016 at 15:04
  • @Rodrigo I updated the code. Better?
    – nebi
    Commented Aug 17, 2016 at 15:24
0

Worked with merge, only the colortable was missing:

m3 <- merge(m1,m2)
m3@legend@colortable <- m1@legend@colortable
plot(m3)

or

m3 <- merge(m1,m2)
m3@legend <- m1@legend
plot(m3)

maskFinal

1
  • I think there must be a faster way to do it, though.
    – Rodrigo
    Commented Aug 17, 2016 at 16:24

Your Answer

By clicking “Post Your Answer”, you agree to our terms of service and acknowledge you have read our privacy policy.

Not the answer you're looking for? Browse other questions tagged or ask your own question.