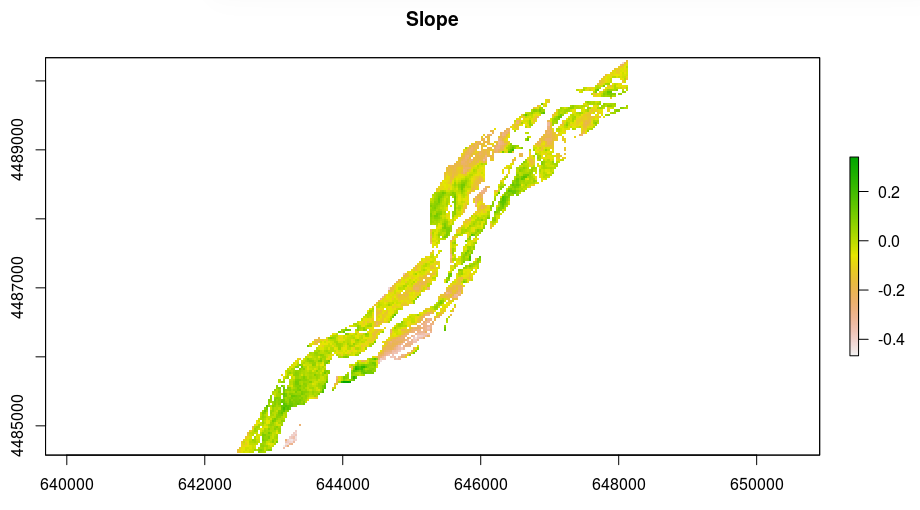
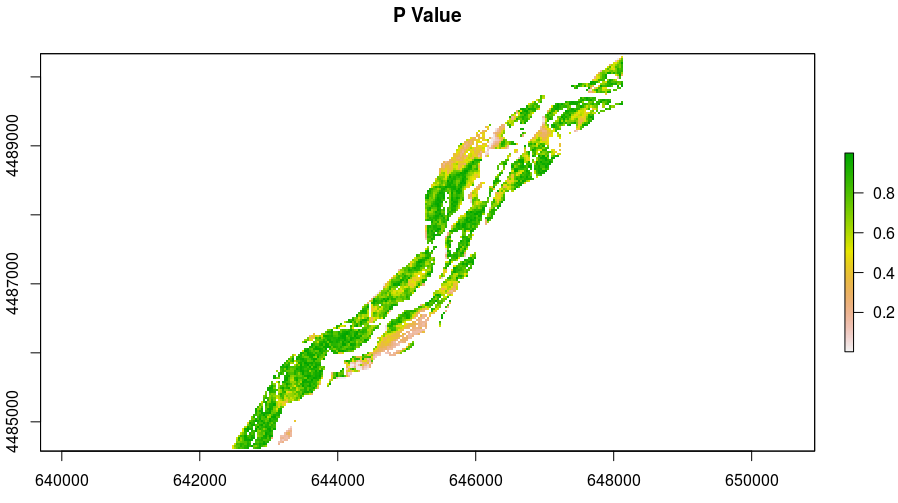
I'm interested in doing a pixel-wize trend analysis of a series of NDVI images from Landsat in R.
The problem is that my images are not exactly happening at regular intervals. But decent imagery of my study area is sporadic and not regular at all (July-21-1992, May-20-1996, ...). Therefore, I can't directly use any of the timeseries packages (ts, greenbrown) to do this. The default assumption of these packages/functions is that your raster stack has a regular time interval (daily, monthly, ...). Here is an example:
Find and stack all the layers:
Library(greenbrown)
all <- list.files("C:/Users/R_test", full.names = TRUE, pattern = "*.tif")
st <- stack(all)
Perform the pixel-wize analysis:
trends <- TrendRaster(st, start = c(1992, 1), freq=1, method=c("ATT"), breaks = 1)
Therefore, my question is how can I implement these gaps into the timeseries before doing any analysis?
I have tried the zoo package and managed to create a vector that has NA for the dates that I dont have imagery, but I'm not sure how to insert the zoo object back into the trend analysis function (here the greenbrown package).
Regards


